 Back
BackCorrelation and Regression: Study Notes
Study Guide - Smart Notes
 Tailored notes based on your materials, expanded with key definitions, examples, and context.
Correlation and Regression
Correlation
Correlation describes the relationship between two variables, indicating whether and how strongly pairs of variables are related. A linear correlation exists when the relationship between two variables can be approximated by a straight line on a scatterplot.
Definition: Correlation exists when the values of one variable are associated with the values of another variable.
Linear Correlation: The plotted points of paired data form a pattern that can be approximated by a straight line.
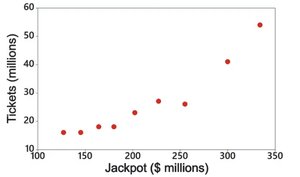
Scatterplot: A graphical representation of paired data, useful for visually assessing the relationship between variables.
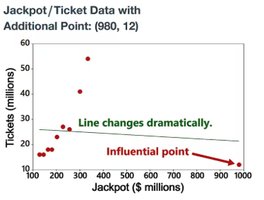
Example: The relationship between lottery jackpot size and the number of tickets sold can be visualized with a scatterplot.
Correlation Coefficient (r)
The linear correlation coefficient (denoted as r) quantifies the strength and direction of a linear relationship between two quantitative variables.
Definition: r measures the strength and direction of the linear correlation between paired x and y values in a sample.
Interpretation: The value of r ranges from -1 to 1.
Requirements for Use:
The sample must be a simple random sample of quantitative data.
Scatterplot should show a straight-line pattern.
Outliers must be addressed, as they can strongly affect r.
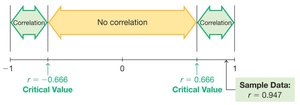
Critical Values: Used to determine if the observed r indicates a statistically significant correlation.
Properties of the Linear Correlation Coefficient
Range:
Scale Invariance: Changing the scale of either variable does not affect r.
Symmetry: Interchanging x and y does not change r.
Linearity: r measures only linear relationships, not nonlinear ones.
Sensitivity to Outliers: r is very sensitive to outliers; a single outlier can dramatically affect its value.
Coefficient of Determination ()
The value of represents the proportion of the variation in y that is explained by the linear relationship between x and y.
Formula:
Interpretation: If , then 81% of the variation in y is explained by x.
Regression
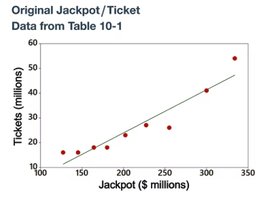
Regression analysis involves finding the best-fitting straight line (regression line) through a set of paired data points. This line is used to model the relationship between an explanatory variable (x) and a response variable (y).
Regression Line: Also called the line of best fit or least-squares line.
Regression Equation: Expresses the relationship between x and y.
Regression Equation:
: Predicted value of y
: y-intercept
: Slope of the regression line
Slope Formula:
Where r is the correlation coefficient, is the standard deviation of y, and is the standard deviation of x.
Making Predictions
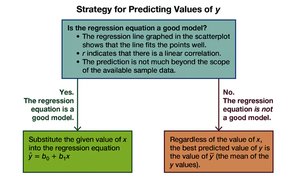
Predictions using the regression equation should only be made if the model is appropriate. The regression equation is considered a good model if:
The regression line fits the scatterplot points well.
There is a significant linear correlation (as indicated by r).
Predictions are not made far beyond the range of the sample data (to avoid extrapolation).
Influential Points and Outliers
Outliers are points that lie far from the other data points. Influential points are those that strongly affect the graph of the regression line. Their presence can dramatically change the regression results.
Outlier: A point far from the other data points in a scatterplot.
Influential Point: A point that, if removed, would significantly change the regression line.
Effect: Outliers and influential points can distort the results of correlation and regression analysis.
Residuals
A residual is the difference between the observed value of y and the value predicted by the regression equation for a given x.
Formula:
Interpretation: Residuals are used to assess the fit of the regression line; smaller residuals indicate a better fit.
