 Back
BackDescribing Data Using Numerical Measures
Study Guide - Smart Notes
 Tailored notes based on your materials, expanded with key definitions, examples, and context.
Chapter 3: Describing Data Using Numerical Measures
Introduction
While graphs and charts are effective for visualizing data, they do not capture all the information present in a dataset. To fully describe and summarize data, statisticians use numerical measures of center and variation. This chapter introduces key concepts and calculations for describing data using these measures.
Measures of Center and Location
Population Parameters and Sample Statistics
Parameter: A numerical measure calculated from the entire population. Parameters are constant as long as the population does not change and are typically denoted by Greek letters (e.g., μ for mean).
Statistic: A numerical measure calculated from a sample drawn from the population. Statistics vary depending on the sample and are usually denoted by Roman letters (e.g., x̄ for sample mean).
Population Mean and Sample Mean
Population Mean (μ): The average of all values in the population.
Sample Mean (x̄): The average of values in a sample.
Formulas:
Population Mean:
Sample Mean:
Impact of Extreme Values on the Mean
The mean is a useful measure of center, but it is sensitive to extreme values (outliers). High outliers pull the mean upward, while low outliers pull it downward. In such cases, the median may provide a better measure of central tendency.
Median
Definition and Calculation
The median is the middle value in a data set arranged in ascending order (a data array).
If the number of observations is odd, the median is the middle value; if even, it is the average of the two middle values.
Example: For the data set [3, 5, 7], the median is 5. For [3, 5, 7, 9], the median is (5+7)/2 = 6.
Mode
Definition and Properties
The mode is the value that occurs most frequently in a data set.
A data set may have one mode (unimodal), more than one mode (bimodal or multimodal), or no mode if all values are unique.
Example: In [2, 4, 4, 6, 7], the mode is 4.
Measures of Variation
Descriptive Measures of Dispersion
Range: The difference between the largest and smallest values in the data set.
Interquartile Range (IQR): The range of the middle 50% of the data (Q3 - Q1).
Variance: The average of the squared deviations from the mean.
Standard Deviation: The square root of the variance; measures the average distance of data points from the mean.
Coefficient of Variation: The ratio of the standard deviation to the mean, often expressed as a percentage.
Formulas:
Sample Variance:
Sample Standard Deviation:
Population Variance:
Population Standard Deviation:
Coefficient of Variation:
Using Data Analysis Function in Excel
Step-by-Step Guide to Calculating Descriptive Statistics
Excel provides a Data Analysis Toolpak that allows users to quickly compute descriptive statistics for a dataset. The following steps illustrate how to use this tool with the "San Carlos Hotel" data example.
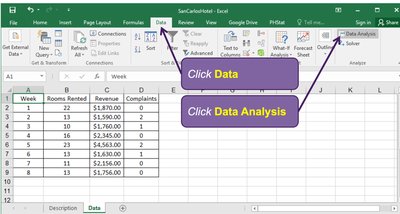
Step 1: Click the Data tab, then select Data Analysis from the ribbon.
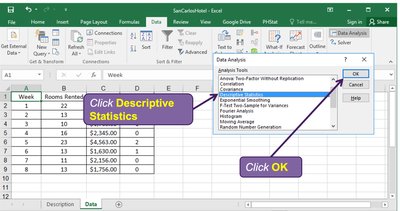
Step 2: In the Data Analysis dialog box, select Descriptive Statistics and click OK.
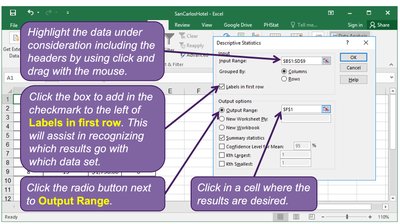
Step 3: Highlight the data range (including headers), check Labels in first row, and specify the Output Range for the results.
Step 4: Check the box for Summary Statistics and click OK to generate the output. Clean up the output as needed for presentation.
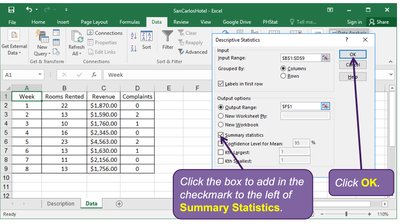
Example Application: The San Carlos Hotel data set can be analyzed using these steps to obtain the mean, median, mode, range, variance, and standard deviation for variables such as Rooms Rented, Revenue, and Complaints.
Additional info: The Data Analysis Toolpak in Excel is a powerful resource for quickly summarizing data and is widely used in business and academic settings for introductory statistical analysis.
