 Back
BackDescribing, Exploring, and Comparing Data (Ch. 3) – Measures of Center and Variation
Study Guide - Smart Notes
 Tailored notes based on your materials, expanded with key definitions, examples, and context.
Describing, Exploring, and Comparing Data
Measures of Center
Measures of center summarize a data set with a single value that represents the middle or typical value of the data. The most common measures are the mean, median, and mode.
Mean (Arithmetic Average)
The mean is calculated by adding all values in a data set and dividing by the number of values. It is sensitive to extreme values (outliers).
Formula:
Population Mean:
Sample Mean:
Population Size:
Sample Size:
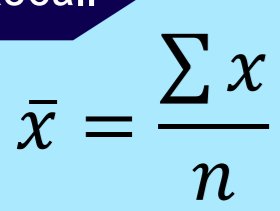
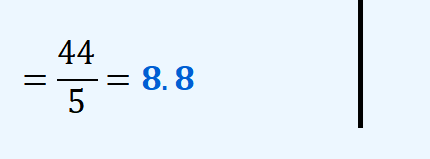
Example: For the data set {5, 10, 14, 12, 3}, the mean is:
Sum: 5 + 10 + 14 + 12 + 3 = 44
Number of values: 5
Mean:
Effect of Outliers: The mean can be greatly affected by extreme values. For example, adding 76 to the previous data set changes the mean significantly.
Median
The median is the middle value when the data are arranged in order. If there is an even number of values, the median is the average of the two middle values. The median is resistant to outliers.
Sort the data from smallest to largest.
If odd number of values: median is the middle value.
If even number of values: median is the average of the two middle values.
Example: For the data set {5, 10, 14, 12, 3}, sorted: {3, 5, 10, 12, 14}, the median is 10.
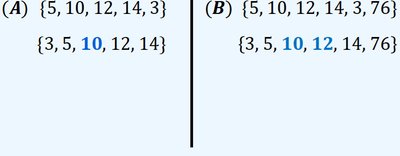
Application: The median is preferred when the data set contains outliers or is skewed.
Comparing Mean and Median
Both mean and median are measures of center, but they have different properties:
Mean: Uses all values; not resistant to outliers.
Median: Only uses the middle value(s); resistant to outliers.
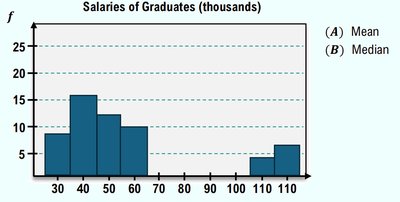
Best Use: Mean is best for symmetric data without outliers; median is best for skewed data or data with outliers.
Mode
The mode is the value that occurs most frequently in a data set. It can be used for both quantitative and qualitative data.
Unimodal: One mode
Bimodal: Two modes
Multimodal: More than two modes
Example: In the data set {0, 0, 0, 2, 2, 3, 4, 1, 2, 2, 0, 4, 1, 3, 0}, the mode is 0 and 2 (bimodal).
Measures of Variation
Measures of variation describe how spread out the data values are. The most common are range, variance, and standard deviation.
Standard Deviation
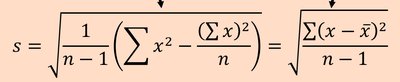
The standard deviation (s for sample, σ for population) measures the average distance of data values from the mean. It is always non-negative and increases as data become more spread out.
Formula (Sample):
Formula (Population):
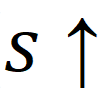
Example: For the data set {5, 10, 12, 14, 3, 4}, calculate the mean, then compute each squared deviation, sum them, and divide by n-1, then take the square root.
Empirical Rule (68-95-99.7 Rule)
The Empirical Rule applies to bell-shaped (normal) distributions:
About 68% of data falls within 1 standard deviation of the mean.
About 95% within 2 standard deviations.
About 99.7% within 3 standard deviations.
Application: Used to estimate the proportion of data within certain ranges in a normal distribution.
Percentiles and Quartiles
Percentiles indicate the percentage of data values below a certain value. Quartiles divide the data into four equal parts:
Q1: 25th percentile
Q2: 50th percentile (median)
Q3: 75th percentile
The Interquartile Range (IQR) is Q3 - Q1 and measures the spread of the middle 50% of data.
Boxplots (Box-and-Whisker Plots)
A boxplot visually displays the five-number summary: minimum, Q1, median, Q3, and maximum. It is useful for comparing distributions and identifying outliers.
Five-number summary: Minimum, Q1, Median, Q3, Maximum
Example: Construct a boxplot for SAT scores or number of songs in playlists using the five-number summary.
Summary Table: Measures of Center and Variation
Measure | Definition | Best Use | Sensitivity to Outliers |
|---|---|---|---|
Mean | Arithmetic average | Symmetric data without outliers | Not resistant |
Median | Middle value | Skewed data or with outliers | Resistant |
Mode | Most frequent value | Qualitative or quantitative data | Resistant |
Standard Deviation | Average distance from mean | Quantitative data | Not resistant |
Additional info: These notes cover the core concepts of describing, exploring, and comparing data, including calculation and interpretation of mean, median, mode, standard deviation, percentiles, quartiles, and boxplots, as well as the Empirical Rule for normal distributions.
