 Back
BackDiscrete and Binomial Probability Distributions: Key Concepts and Applications
Study Guide - Smart Notes
 Tailored notes based on your materials, expanded with key definitions, examples, and context.
Discrete Probability Distributions
Discrete and Continuous Random Variables
A random variable is a numerical measure of the outcome of a probability experiment, determined by chance. Random variables are typically denoted by capital letters such as X.
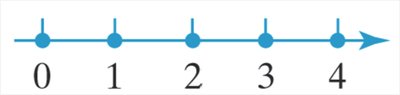
Discrete random variable: Has a finite or countable number of possible values. These values can be plotted on a number line with space between each point.
Continuous random variable: Has infinitely many possible values, which can be plotted on a line in an uninterrupted fashion.
Example: The number of pieces of candy in a bag is discrete, while the mass of each piece is continuous.

Discrete Probability Distributions
A discrete probability distribution provides the possible values of a discrete random variable and their corresponding probabilities. It can be represented as a table, graph, or mathematical formula.
Rules for Discrete Probability Distributions:
All probabilities must be between 0 and 1:
The sum of all probabilities must equal 1:
Example: In the game Chuck-a-Luck, the random variable X represents the profit from a $1 bet. The probability distribution is given in a table format, showing the profit and corresponding probability for each possible outcome.
Graphing Discrete Probability Distributions
Discrete probability distributions can be visualized using bar graphs, where the x-axis represents the possible values of the random variable and the y-axis represents the probability of each value.
Mean and Expected Value of a Discrete Random Variable
The mean (or expected value) of a discrete random variable X is a measure of its long-run average value, calculated as:
Interpretation: If an experiment is repeated many times, the average value of the outcomes will approach the mean.
Expected Value: The mean is also called the expected value, denoted as E(X).
Example: Calculating the expected profit in a game or investment scenario using the possible outcomes and their probabilities.
Standard Deviation of a Discrete Random Variable
The standard deviation measures the spread of the values of a discrete random variable from its mean. It is calculated as:
Interpretation: A larger standard deviation indicates greater variability in the possible outcomes.
The Binomial Probability Distribution
Identifying Binomial Experiments
A binomial experiment is a probability experiment that satisfies the following criteria:
The experiment is performed a fixed number of times (n trials).
The trials are independent.
Each trial has two mutually exclusive outcomes: success or failure.
The probability of success (p) is the same for each trial.
Notation:
n: number of trials
p: probability of success
X: number of successes in n trials
Constructing and Interpreting Binomial Probability Distributions
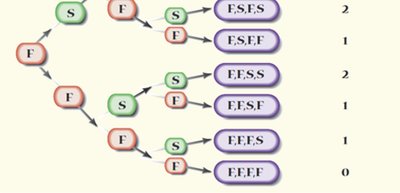
The binomial probability distribution gives the probability of obtaining exactly x successes in n independent trials, each with probability p of success. The probability mass function is:
Where is the binomial coefficient, representing the number of ways to choose x successes from n trials.
Example: Calculating the probability of a certain number of on-time flights out of a sample of flights.

Computing Binomial Probabilities
To find the probability of exactly x successes, use the binomial formula above.
To find the probability of fewer than, at least, or between certain numbers of successes, sum the probabilities for the relevant values of x.
Interpreting Probability Phrases
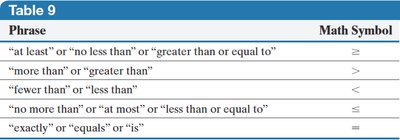
Common phrases in probability problems correspond to mathematical symbols:
Phrase | Math Symbol |
|---|---|
at least / no less than / greater than or equal to | ≥ |
more than / greater than | > |
fewer than / less than | < |
no more than / at most / less than or equal to | ≤ |
exactly / equals / is | = |
Mean and Standard Deviation of a Binomial Random Variable
For a binomial random variable X with n trials and probability of success p:
Mean (expected value):
Standard deviation:
These formulas allow you to determine the average number of successes and the variability in the number of successes for a binomial experiment.
Shape of the Binomial Distribution
As the number of trials n increases, the binomial distribution becomes more bell-shaped, especially when .
For small n or extreme values of p, the distribution may be skewed.
Using the Mean, Standard Deviation, and Empirical Rule
The empirical rule can be used to determine if an observed result in a binomial experiment is unusual. If the observed value is more than two standard deviations from the mean, it is considered unusual.
