 Back
BackDiscrete Probability Distributions: Random Variables, Mean, Variance, and Expected Value
Study Guide - Smart Notes
 Tailored notes based on your materials, expanded with key definitions, examples, and context.
Section 4.1: Probability Distributions
Section 4.1 Objectives
This section introduces the foundational concepts of probability distributions, focusing on discrete random variables. Students will learn to distinguish between discrete and continuous random variables, construct and analyze discrete probability distributions, and compute key statistical measures such as mean, variance, standard deviation, and expected value.
Distinguish between discrete and continuous random variables
Construct a discrete probability distribution and its graph
Determine if a distribution is a probability distribution
Find the mean, variance, and standard deviation of a discrete probability distribution
Find the expected value of a discrete probability distribution
Random Variables
Definition and Types
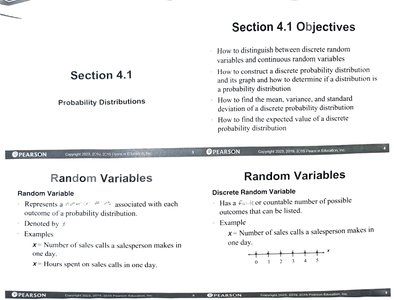
A random variable is a numerical value associated with each outcome of a probability distribution. Random variables are typically denoted by capital letters such as X.
Discrete Random Variable: Has a finite or countable number of possible outcomes that can be listed. Example: X = Number of sales calls a salesperson makes in one day (e.g., 0, 1, 2, 3, ...).
Continuous Random Variable: Has an uncountable number of possible outcomes, represented by an interval on the number line. Example: X = Hours spent on sales calls in one day (e.g., any value between 0 and 24).
Discrete Probability Distributions
Definition and Properties
A discrete probability distribution lists each possible value the random variable can assume, together with its probability. The distribution must satisfy two conditions:
The probability of each value is between 0 and 1, inclusive:
The sum of all probabilities is 1:
Constructing a Discrete Probability Distribution
List all possible outcomes of the discrete random variable.
Make a frequency distribution for the possible outcomes.
Find the sum of the frequencies.
Calculate the probability of each outcome by dividing its frequency by the total frequency.
Verify that each probability is between 0 and 1 and that their sum is 1.
Mean of a Discrete Probability Distribution
Definition and Calculation
The mean (or expected value) of a discrete probability distribution is calculated by multiplying each value of the random variable by its corresponding probability and summing the results:
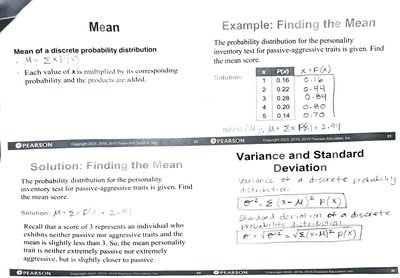
Example: For a personality inventory test with scores 1 to 5 and probabilities 0.16, 0.22, 0.28, 0.20, 0.14, the mean is calculated as:
Interpretation: The mean score represents the average expected value for the random variable, which in this example is slightly less than 3, indicating a tendency toward passivity.
Variance and Standard Deviation of a Discrete Probability Distribution
Definitions and Formulas
Variance: Measures the spread of the distribution.
Standard Deviation: The square root of the variance.
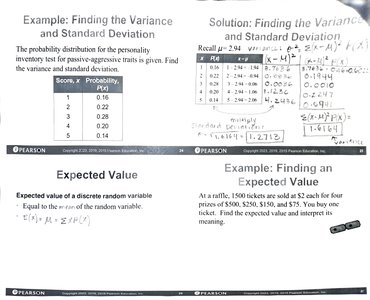
Example: Using the same probability distribution as above, calculate each , sum the results for variance, and take the square root for standard deviation.
Expected Value
Definition and Application
The expected value of a discrete random variable is equal to its mean and represents the long-term average outcome of a random process:
Example: In a raffle with 1500 tickets sold at $2 each for four prizes ($500, $250, $150, $75), the expected value for a single ticket is calculated by finding the gain for each prize (prize minus ticket cost), multiplying by the probability of winning, and summing all possible outcomes (including the loss if no prize is won). The expected value is negative, indicating an average loss per ticket purchased.
Interpretation: The expected value helps in decision-making by quantifying the average gain or loss over many repetitions of the random experiment.
