 Back
BackDiscrete Probability Distributions: Study Guide
Study Guide - Smart Notes
 Tailored notes based on your materials, expanded with key definitions, examples, and context.
Discrete Probability Distributions
Discrete Random Variables
Discrete random variables (DRVs) are fundamental in statistics, representing outcomes that can only take specific, separate values. These variables are contrasted with continuous random variables, which can take any value within a range.
Definition: A random variable is a numerical outcome determined by a random experiment.
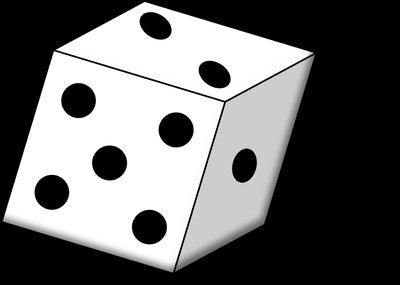
Discrete Random Variable (DRV): Values cannot be broken down further (e.g., number of defective lightbulbs).
Continuous Random Variable (CRV): Values can be broken down further (e.g., height, time).
Probability Distribution: Shows the probability for each possible value a random variable can take.
Example: Number of sodas consumed per day, number of prizes won in a raffle.
Practice: Identify which variables are discrete: number of defective lightbulbs, number of days in a month.
Probability Distribution Tables
Probability distributions for discrete random variables are often represented in tables, showing each possible value and its associated probability.
Criteria: Probabilities must sum to 1; each probability must be between 0 and 1.
Example Table:
Profit | Probability |
|---|---|
-1.00 | 0.40 |
0.00 | 0.35 |
5.00 | ? |
1,000,000.00 | 0.01 |
Example: Find the missing probability so that the total equals 1.
Mean (Expected Value) of Discrete Random Variables
The mean or expected value of a DRV is the long-run average value of the variable, calculated by multiplying each value by its probability and summing the results.
Formula:
Example: Number of kids per household:
# of Kids | Probability |
|---|---|
0 | 0.15 |
1 | 0.60 |
2 | 0.25 |
Practice: Calculate the expected value for the number of defective bulbs in a batch.
Variance and Standard Deviation of Discrete Random Variables
Variance and standard deviation measure the spread of a probability distribution. For DRVs, these are calculated using the mean and the probabilities.
Variance Formula:
Standard Deviation:
Example: Number of complaints received daily.
# of Complaints | Probability |
|---|---|
0 | 0.45 |
1 | 0.30 |
2 | 0.20 |
3 | 0.05 |
Practice: Calculate variance and standard deviation for the number of kids per household.
Binomial Distribution
The Binomial Experiment
The binomial distribution models the number of successes in a fixed number of independent trials, each with the same probability of success.
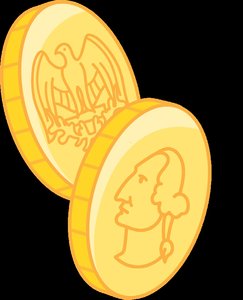
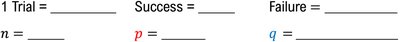
Criteria: Two outcomes (success/failure), fixed number of trials, independent trials, constant probability of success.
Example: Coin flips, marble draws with replacement.

Practice: Determine if an experiment is binomial and identify n and p.
Binomial Probability Formula
To find the probability of exactly k successes in n trials:
Formula: , where
Example: Probability of getting exactly 3 red marbles in 4 draws.
Mean and Standard Deviation of Binomial Distribution
The mean and standard deviation of a binomial distribution can be calculated directly from n and p.
Mean:
Standard Deviation:
Example: Expected number of customers purchasing a product.
Multiple Probabilities in Binomial Distributions
To find probabilities for ranges (e.g., "at least", "between"), sum the relevant probabilities or use complements.
Keywords: "exactly", "at most", "at least", "between".
Example: Probability that at least 3 customers open an email.
Finding Binomial Probabilities Using TI-84 Calculator
TI-84 calculators can compute binomial probabilities using binompdf (for exact) and binomcdf (for cumulative probabilities).
binompdf: Probability of exactly x successes.
binomcdf: Probability of x or fewer successes.

Poisson Distribution
Intro to Poisson Distribution
The Poisson distribution models the number of occurrences of an event in a fixed interval of time or space, given a known average rate.
Criteria: Events occur independently, fixed interval, mean rate known.
Formula:
Mean and Variance: ,
Example: Number of customers entering a bakery in 15 minutes.
Finding Poisson Probabilities Using TI-84 Calculator
TI-84 calculators use poissonpdf (for exact) and poissoncdf (for cumulative probabilities).
poissonpdf: Probability of exactly x occurrences.
poissoncdf: Probability of x or fewer occurrences.


Poisson Approximation to Binomial
When n is large and p is small, the Poisson distribution can approximate binomial probabilities.
Requirements: ,
Formula:
Hypergeometric Distribution
Intro to Hypergeometric Distribution
The hypergeometric distribution models the probability of k successes in n draws from a finite population without replacement.
Criteria: Two outcomes, fixed number of draws, no replacement.
Formula:
Example: Drawing marbles from a bag without replacement.


Practice: Decide whether to use binomial or hypergeometric distribution based on whether sampling is with or without replacement.
Applications and Practice
These distributions are used in quality control, survey analysis, and predicting outcomes in random experiments. Practice problems involve calculating probabilities, expected values, and variances for real-world scenarios.
