 Back
BackDiscrete Probability Distributions: Study Guide for Statistics Students
Study Guide - Smart Notes
 Tailored notes based on your materials, expanded with key definitions, examples, and context.
Discrete Probability Distributions
Discrete Random Variables
Discrete random variables (DRVs) are fundamental in statistics, representing outcomes that can only take specific, countable values. Understanding DRVs is essential for analyzing experiments where the possible results are distinct and separate.
Definition: A random variable is a numerical value assigned to each outcome of an experiment.
Discrete Random Variable (DRV): Values cannot be broken down further (e.g., number of defective lightbulbs).
Continuous Random Variable (CRV): Values can be broken down further (e.g., height, time).
Probability Distribution: Shows the probability for each possible value of a random variable.
Criteria for a Probability Distribution:
Each probability must be between 0 and 1.
The sum of all probabilities must equal 1.
Example: Number of sodas consumed per day, number of defective bulbs in a batch.
Identifying Discrete Random Variables
Examples include the number of defective lightbulbs, number of days in a month, or prizes won in a raffle.
Continuous variables include time taken to complete a race or weight of apples.
Probability Distributions for Discrete Random Variables
Probability distributions for DRVs are often represented in tables, showing the probability for each possible outcome.
Example Table: Probability distribution for lottery profits:
Profit | Probability |
|---|---|
-1.00 | 0.40 |
0.00 | 0.35 |
5.00 | ? |
1,000,000.00 | 0.01 |
Application: Verify the table meets the criteria for a probability distribution and solve for missing probabilities.
Mean (Expected Value) of Discrete Random Variables
The mean or expected value of a DRV is the long-run average value of the variable after many repetitions of the experiment.
Formula:
Multiply each value by its probability, then sum the results.
Example: Number of kids per household:
# of Kids | Probability |
|---|---|
0 | 0.15 |
1 | 0.60 |
2 | 0.25 |
Application: Calculate the expected value using the formula above.
Variance and Standard Deviation of Discrete Random Variables
Variance and standard deviation measure the spread of a probability distribution.
Variance Formula:
Standard Deviation:
Make a table with columns for , , , and .
Example: Number of complaints received daily.
Binomial Distribution
The Binomial Experiment
The binomial distribution models the number of successes in a fixed number of independent trials, each with the same probability of success.
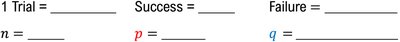
Criteria:
Fixed number of trials ()
Each trial is independent
Only two outcomes: success or failure
Probability of success () is constant for each trial
Example: Flipping a coin, drawing marbles with replacement, rolling dice for a specific outcome.

Binomial Probability Formula
To calculate the probability of exactly successes in trials:
Formula: , where
Combination Formula:
Example: Probability of getting exactly 3 red marbles in 4 draws.
Mean and Standard Deviation of Binomial Distribution
The mean and standard deviation of a binomial distribution can be calculated directly from and .
Mean:
Variance:
Standard Deviation:
Example: Expected number of customers purchasing a product after a demonstration.
Multiple Probabilities in Binomial Distributions
Keywords such as "between," "at least," or "at most" require summing probabilities for multiple outcomes.
Complement Rule:
Application: Probability that at least 3 customers open an email.
Finding Binomial Probabilities Using a TI-84 Calculator
TI-84 calculators provide functions for binomial probabilities:
binompdf: For exact probabilities
binomcdf: For cumulative probabilities (e.g., "at most," "at least")
Example: Probability that exactly 50 light bulbs are defective out of 1,000 produced.


Poisson Distribution
Intro to Poisson Distribution
The Poisson distribution models the number of occurrences of an event in a fixed interval of time or space, given a constant mean rate.
Criteria:
Events occur independently
Fixed interval (time, area, etc.)
Mean rate () is constant
Example: Number of birds landing on a feeder per hour, number of customers entering a bakery every 15 minutes.
Poisson Probability Formula
Formula:
Mean:
Variance:
Example: Probability that exactly 3 birds land on a feeder in one hour.
Using Poisson Distribution to Approximate Binomial Probabilities
When is large and is small, the Poisson distribution can approximate binomial probabilities.
Requirements: ,
Substitute:
Example: Estimating the probability that 2 students win prizes in a school raffle.
Finding Poisson Probabilities Using a TI-84 Calculator
TI-84 calculators provide functions for Poisson probabilities:
poissonpdf: For exact probabilities
poissoncdf: For cumulative probabilities
Example: Probability that exactly 15 cars go through an intersection in one minute.
Hypergeometric Distribution
Intro to Hypergeometric Distribution
The hypergeometric distribution models the probability of successes in draws from a finite population without replacement.
Criteria:
Fixed number of draws ()
Population size () is finite
Number of successes in population ()
Draws are without replacement
Example: Drawing marbles from a bag without replacement.


Hypergeometric Probability Formula
Formula:
Application: Probability of drawing exactly 1 red marble from a bag of 2 red and 4 blue marbles in 3 draws without replacement.
Choosing the Correct Distribution
Binomial: Use when sampling with replacement or when each trial is independent and has a constant probability.
Hypergeometric: Use when sampling without replacement from a finite population.
Example: School raffle with tickets replaced after each draw (binomial) vs. tickets removed after each draw (hypergeometric).
Summary Table: Comparison of Distributions
Distribution | Criteria | Formula |
|---|---|---|
Binomial | Fixed trials, independent, constant p, two outcomes | |
Poisson | Events in fixed interval, constant mean rate, independent | |
Hypergeometric | Draws without replacement, finite population |
Additional info: This guide expands on brief points with full academic explanations, formulas, and relevant examples, ensuring completeness and clarity for exam preparation.
