 Back
BackDot Plots: Interpreting Coffee Consumption Data
Study Guide - Smart Notes
 Tailored notes based on your materials, expanded with key definitions, examples, and context.
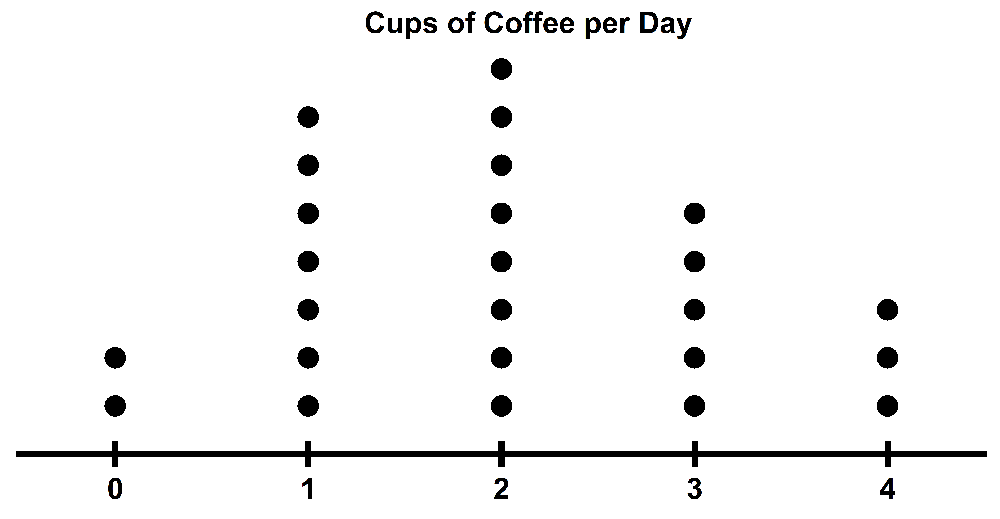
Q5. A group of 25 people was surveyed about the number of cups of coffee they drink per day. The results are: 0, 1, 2, 2, 3, 1, 0, 2, 3, 4, 2, 1, 2, 3, 0, 1, 2, 4, 1, 2, 3, 1, 4, 2, 3. Create a dot plot for this data and describe any patterns you notice.
Background
Topic: Dot Plots and Data Visualization
This question tests your ability to construct and interpret a dot plot, which is a simple way to display frequency distributions for small data sets. You are also asked to describe patterns such as the mode (most common value) and the symmetry of the distribution.
Key Terms and Concepts:
Dot Plot: A graphical display where each data value is shown as a dot above its corresponding value on a number line.
Mode: The value(s) that appear most frequently in the data set.
Symmetry: A distribution is symmetric if the left and right sides are mirror images.
Step-by-Step Guidance
First, organize the data by counting how many times each value (0, 1, 2, 3, 4) appears in the list. This will help you determine the frequency for each number of cups.
Draw a number line from 0 to 4 (since these are the possible numbers of cups per day). For each value, stack a dot above the number for each person who reported that value.
Once the dot plot is constructed, observe which value has the highest stack of dots. This value is the mode (the most common number of cups consumed per day).
Examine the overall shape of the dot plot. Is it roughly symmetric around a central value, or is it skewed to one side? This will help you describe the distribution pattern.
Try solving on your own before revealing the answer!
Final Answer:
The most common number of cups is 2, and the plot is roughly symmetric around 2 cups per day.
This means that 2 cups is the mode, and the distribution of coffee consumption is centered around this value, with similar frequencies on either side.
