 Back
BackEstimating Parameters and Determining Sample Sizes: Confidence Intervals for Population Mean and Proportion
Study Guide - Smart Notes
 Tailored notes based on your materials, expanded with key definitions, examples, and context.
Estimating the Population Mean
Key Concepts
Estimating the population mean is a fundamental task in inferential statistics. When the population standard deviation (σ) is not known, special methods are required to construct confidence intervals for the mean. The following requirements must be met:
The sample must be a simple random sample.
Either the population is normally distributed or the sample size n > 30.
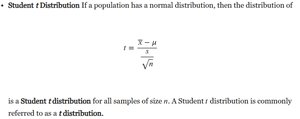
Student's t-Distribution
The Student's t-distribution is used when the population standard deviation is unknown and the sample size is small. It is similar to the normal distribution but has heavier tails, which accounts for the additional uncertainty from estimating σ.
The t-distribution is defined for all samples of size n from a normal population.
It is commonly referred to as a t distribution.
The t statistic is calculated as:
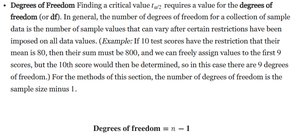
Degrees of Freedom
Degrees of freedom (df) are required to find the critical value for the t-distribution. In this context, the degrees of freedom are equal to the sample size minus one:
Degrees of freedom represent the number of values in the sample that are free to vary after certain restrictions are imposed.
For example, if the mean of 10 scores is fixed, only 9 scores can vary freely.
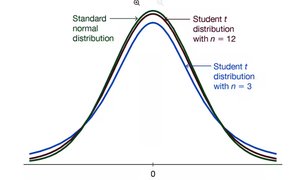
Comparing t-Distribution and Normal Distribution
The t-distribution approaches the normal distribution as the sample size increases. For small sample sizes, the t-distribution has heavier tails, reflecting greater variability.
For n = 3, the t-distribution is much wider than the normal distribution.
For n = 12, the t-distribution is closer to the normal distribution.
Constructing a Confidence Interval for the Population Mean
To construct a confidence interval for the population mean when σ is unknown, use the t-distribution:
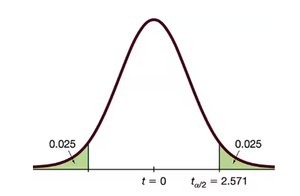
Find the critical value for the desired confidence level.
The confidence interval is given by:
Example: Confidence Interval Calculation
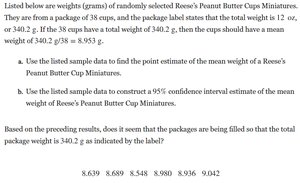
Suppose you have weights (grams) of randomly selected Reese's Peanut Butter Cups Miniatures. The sample data is:
8.639, 8.689, 8.548, 8.980, 8.936, 9.042
Find the point estimate of the mean weight.
Construct a 95% confidence interval for the mean weight.
Interpret whether the packages are being filled as indicated by the label.
Estimating Population Proportion When the Population Standard Deviation is Known
Confidence Interval Using the Standard Normal Distribution
When σ is known, the confidence interval for the population mean is constructed using the standard normal (z) distribution:
Choosing the Appropriate Method
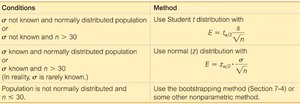
The method for constructing a confidence interval depends on whether σ is known and the sample size:
Conditions | Method |
|---|---|
σ not known and normally distributed population or σ not known and n > 30 | Use Student t distribution with |
σ known and normally distributed population or σ known and n > 30 (in reality, σ is rarely known) | Use normal (z) distribution with |
Population is not normally distributed and n > 30 | Use the bootstrapping method or other nonparametric methods |
Finding Sample Size
Determining Sample Size for Estimation
To estimate a population mean or proportion with a specified margin of error and confidence level, formulas are used to calculate the required sample size. The choice of formula depends on whether σ is known and the desired confidence level.
For the mean, use the formula involving z or t critical values, margin of error, and standard deviation.
For the proportion, use the formula involving the estimated proportion and desired margin of error.
Additional info: The bootstrapping method is a resampling technique used when the population is not normally distributed and the sample size is large. It does not rely on parametric assumptions.
