 Back
BackEven You Can Learn Statistics: Mini-Textbook Study Notes (Chapters 1–6)
Study Guide - Smart Notes
 Tailored notes based on your materials, expanded with key definitions, examples, and context.
Fundamentals of Statistics
The Five Basic Words of Statistics
Statistics relies on a precise vocabulary to describe data and its analysis. The five foundational terms are:
Population: All members of a group about which you want to draw a conclusion. Example: All registered voters in a country.
Sample: A subset of the population selected for analysis. Example: 100 voters chosen for a survey.
Parameter: A numerical measure describing a characteristic of a population. Example: The average age of all voters.
Statistic: A numerical measure describing a characteristic of a sample. Example: The average age in the sample of 100 voters.
Variable: A characteristic of an item or individual to be analyzed. Example: Age, gender, or income.
Variables can be categorical (e.g., gender, major) or numerical (e.g., income, age). Numerical variables are further classified as discrete (counts) or continuous (measurements).
The Branches of Statistics
Descriptive Statistics: Methods for collecting, summarizing, and presenting data. Example: Calculating the mean or creating a bar chart.
Inferential Statistics: Methods for drawing conclusions about a population based on sample data. Example: Using a sample mean to estimate the population mean.
Sources of Data
Published Sources: Data from books, articles, or online databases.
Experiments: Controlled studies with treatment and control groups.
Surveys: Data collected via questionnaires or interviews.
Sampling Concepts
Sampling: The process of selecting a subset from a population.
Probability Sampling: Each member has a known chance of selection. Simple Random Sampling gives every possible sample an equal chance.
Frame: The list from which the sample is drawn.
Sample Selection Methods
With Replacement: Selected items are returned to the frame and can be chosen again.
Without Replacement: Selected items are not returned; each can be chosen only once.
Stratified Sampling: Population divided into subgroups (strata), and random samples taken from each.
Cluster Sampling: Population divided into clusters, some clusters are randomly selected, and all or some items within are studied.

Presenting Data in Charts and Tables
Presenting Categorical Data
Summary Table: Lists categories and their counts or percentages.
Bar Chart: Rectangles represent counts or percentages for each category.
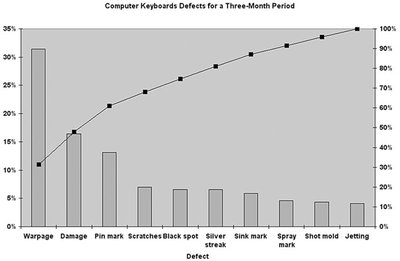
Pareto Diagram: Bar chart with categories in descending order and a cumulative percentage line. Purpose: Highlights the "vital few" categories. Example: Keyboard defects by type.
Presenting Numerical Data
Frequency and Percentage Distribution: Table showing how many values fall into each group.
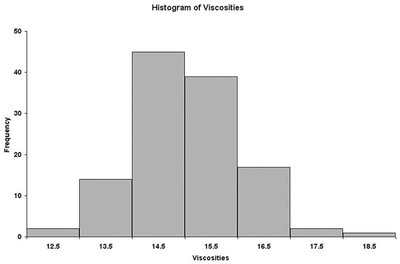
Histogram: Bar chart for numerical data, with no gaps between bars. Purpose: Shows the shape of the data distribution.
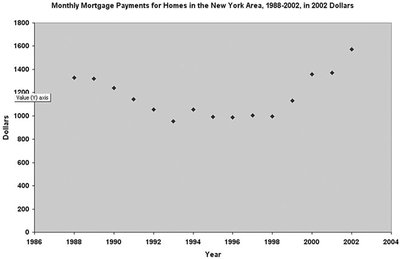
Time-Series Plot: Plots values over time to reveal trends or patterns.
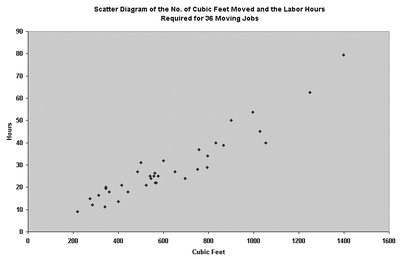
Scatter Plot: Plots two numerical variables to show relationships or correlations.
Misusing Graphs
Graphs can mislead if axes are not labeled, scales are inconsistent, or pictorial symbols distort the data.

Descriptive Statistics for Numerical Variables
Measures of Central Tendency
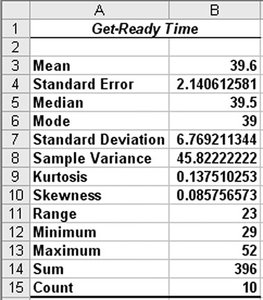
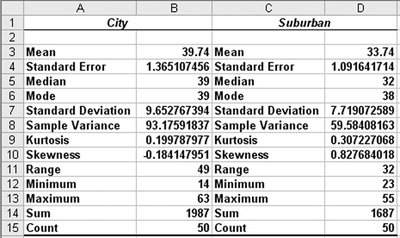
Mean (Arithmetic Average): Example: Average get-ready time over 10 days.
Median: The middle value when data are ordered. Formula: th ranked value.
Mode: The most frequently occurring value.
Quartiles: Values that divide data into four equal parts (Q1, Q2/median, Q3).
Measures of Variation
Range: Largest value minus smallest value.
Variance:
Standard Deviation:
Z Score: Purpose: Identifies how many standard deviations a value is from the mean.

Shape of Distributions
Symmetrical: Mean = Median.
Left-Skewed: Mean < Median.
Right-Skewed: Mean > Median.
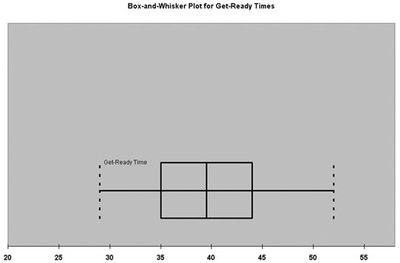
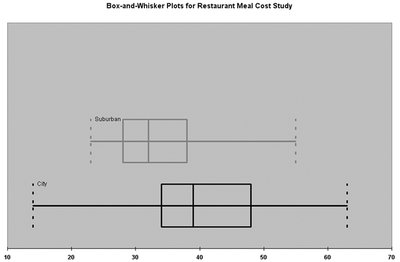
Box-and-Whisker Plot
Displays the five-number summary (min, Q1, median, Q3, max) to visualize distribution shape and outliers.

Probability
Basic Concepts
Event: An outcome of an experiment or survey.
Elementary Event: An outcome that satisfies only one criterion.
Random Variable: A variable whose values are determined by chance.
Probability: A number between 0 and 1 representing the likelihood of an event.
Collectively Exhaustive Events: A set of events that includes all possible outcomes.
Rules of Probability
Probabilities are between 0 and 1.
The probability of an event not occurring is .
If two events are mutually exclusive, .
If two events are independent, .
Assigning Probabilities
Classical Approach: Based on known possible outcomes (e.g., dice rolls).
Empirical Approach: Based on observed data (e.g., survey results).
Subjective Approach: Based on expert judgment or intuition.
Probability Distributions
Discrete Probability Distributions
Definition: Lists all possible outcomes and their probabilities for a discrete random variable.
Expected Value:
Standard Deviation:
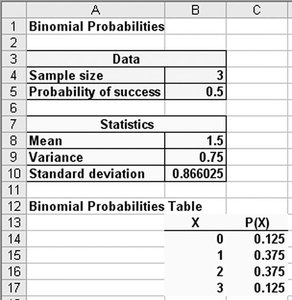
Binomial Distribution
Used for random variables with two outcomes (success/failure) in a fixed number of trials.
Formula:
Mean:
Variance:
Poisson Distribution
Used for counting the number of events in a fixed interval of time or space.
Formula:
Mean and Variance:
Continuous Probability Distributions and the Normal Distribution
Normal Distribution: Bell-shaped, symmetric, defined by mean () and standard deviation ().
Z Score:
Probabilities are areas under the curve; use tables or software to find probabilities.
Sampling Distributions and Confidence Intervals
Sampling Distributions
Sampling Distribution: The distribution of a sample statistic (e.g., mean) for all possible samples of a given size.
Central Limit Theorem: For large enough samples (n ≥ 30), the sampling distribution of the mean is approximately normal, regardless of the population's shape.
Confidence Intervals
Confidence Interval: An interval estimate for a population parameter, with a specified level of confidence (e.g., 95%).
Formula for Mean (σ unknown):
Formula for Proportion:
Additional info: These notes cover the foundational chapters of a college-level statistics course, including vocabulary, data presentation, descriptive statistics, probability, probability distributions, and introductory inferential statistics. All images included are directly relevant to the explanation of the adjacent paragraphs and reinforce key statistical concepts and methods.
