 Back
BackHypothesis Testing for One Sample: Study Notes
Study Guide - Smart Notes
 Tailored notes based on your materials, expanded with key definitions, examples, and context.
Hypothesis Testing for One Sample
Introduction to Hypothesis Testing
Hypothesis testing is a fundamental statistical method used to make inferences about population parameters based on sample data. It involves formulating a null hypothesis (H0) and an alternative hypothesis (Ha), then using sample statistics to determine whether to reject H0 at a specified significance level.
Null Hypothesis (H0): The statement being tested, usually a statement of 'no effect' or 'no difference'.
Alternative Hypothesis (Ha): The statement we are trying to find evidence for.
Significance Level (α): The probability of rejecting the null hypothesis when it is true, commonly set at 0.05 or 0.01.
Test Statistic: A standardized value (such as z or t) used to determine the probability of observing the sample data under H0.
p-value: The probability of obtaining a result at least as extreme as the observed result, assuming H0 is true.
One-Sample z-Test for Means
The one-sample z-test is used when the population standard deviation is known and the sample size is large (n > 30). It tests whether the sample mean differs significantly from a hypothesized population mean.
Formula:
Decision Rule: Compare the calculated z-value to the critical z-value for the chosen significance level. If |z| > zcritical, reject H0.
Example: Testing if the mean is equal to 50 with n = 30, α = 0.05.
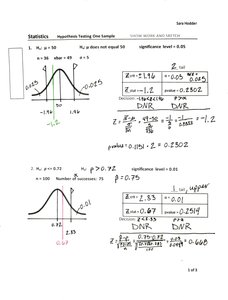
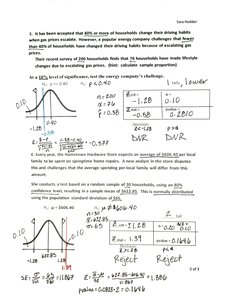
One-Sample z-Test for Proportions
The one-sample z-test for proportions is used to test whether the sample proportion differs significantly from a hypothesized population proportion.
Formula:
Example: Testing if 76 out of 200 households have changed their driving habits, with a hypothesized proportion of 0.67.
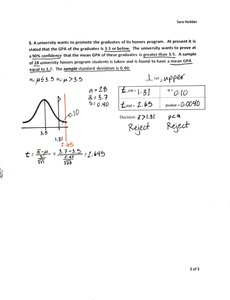
One-Sample t-Test for Means
The one-sample t-test is used when the population standard deviation is unknown and the sample size is small (n < 30). It tests whether the sample mean differs significantly from a hypothesized population mean.
Formula:
Degrees of Freedom: df = n - 1
Decision Rule: Compare the calculated t-value to the critical t-value for the chosen significance level and degrees of freedom.
Example: Testing if the mean GPA of honors graduates is greater than 3.5 with n = 28.
Interpreting Results
After calculating the test statistic and p-value, compare the p-value to the significance level:
If p-value < α, reject H0.
If p-value > α, fail to reject H0.
Always state the conclusion in the context of the problem.
Summary Table: Hypothesis Testing for One Sample
Test Type | Population Parameter | Sample Size | Statistic | Formula |
|---|---|---|---|---|
z-test for mean | Mean (μ) | n > 30 | z | |
z-test for proportion | Proportion (p) | n > 30 | z | |
t-test for mean | Mean (μ) | n < 30 | t |
Additional info: The notes also include real-world applications such as testing company claims about household behavior and university GPA statistics, reinforcing the practical use of hypothesis testing.
