 Back
BackInferences from Two Samples: Proportions, Means, and Variances
Study Guide - Smart Notes
 Tailored notes based on your materials, expanded with key definitions, examples, and context.
Inferences from Two Samples
Introduction
This chapter focuses on statistical methods for comparing two populations using sample data. The main topics include hypothesis testing and confidence intervals for differences in proportions, means, and variances. These methods are essential for determining whether observed differences between groups are statistically significant.
Two Proportions
Hypothesis Tests for Two Proportions
When comparing two population proportions, hypothesis tests help determine if there is a significant difference between them. The null hypothesis typically states that the proportions are equal, while the alternative hypothesis suggests a difference.
Null Hypothesis (H0): or
Alternative Hypothesis (Ha): , , or
Test Statistic: The z-score is calculated using the pooled sample proportion:
,
,
Conditions: Samples must be random and independent, with at least 5 successes and 5 failures in each sample.
Example: Effectiveness of Nicotine Patch
Suppose 11 out of 20 subjects quit smoking with a placebo, and 17 out of 23 quit with a nicotine patch. A hypothesis test can determine if the proportions differ significantly.
Confidence Intervals for Two Proportions
A confidence interval estimates the difference between two population proportions. Unlike hypothesis tests, use individual sample proportions (not pooled).
Point Estimate:
Margin of Error:
Confidence Interval:
If the interval does not include 0, there is evidence of a difference between the proportions.
Calculator Procedures for Two Proportions
Statistical calculators (e.g., TI-84) provide functions for hypothesis tests and confidence intervals for two proportions:
2-PropZTest: For hypothesis testing
2-PropZInt: For confidence intervals
Two Means
Unknown, Unequal Variances (Welch's t-test)
When comparing means from two independent samples with unknown and unequal variances, use the Welch's t-test.
Null Hypothesis (H0): or
Test Statistic:
Degrees of freedom are approximated using the smaller of and .
Unknown, Equal Variances (Pooled t-test)
If population variances are assumed equal, use the pooled t-test:
Pooled Variance:
Test Statistic:
Degrees of freedom:
Known Variances (z-test)
If population variances are known, use the z-test for two means:
Matched Pairs (Dependent Samples)
Matched pairs occur when each observation in one sample is paired with a related observation in the other. The analysis focuses on the differences within pairs.
Test Statistic:
: mean of the differences, : standard deviation of differences, : number of pairs
Confidence Intervals for Two Means
Confidence intervals for the difference in means are constructed similarly to hypothesis tests, using the appropriate formula for the scenario (unknown/known variances, matched pairs).
Calculator Procedures for Two Means
Statistical calculators provide functions for hypothesis tests and confidence intervals for two means:
2-SampTTest: For unknown variances
2-SampZTest: For known variances
2-SampTInt: For confidence intervals
Two Variances and the F-Distribution
F-Distribution
The F-distribution is used to compare two population variances. It is always right-skewed and only takes positive values. The test statistic is the ratio of sample variances:
Degrees of freedom: ,

Hypothesis Tests for Two Variances
To test if two population variances are equal, set up hypotheses:
Null Hypothesis (H0):
Alternative Hypothesis (Ha): , , or
The F-statistic is compared to critical values from the F-distribution. If the P-value is less than the significance level, reject the null hypothesis.
Calculator Procedures for Two Variances
Statistical calculators provide functions for F-tests:
Enter data into lists (L1, L2), select the F-test function, and input sample variances and sizes.
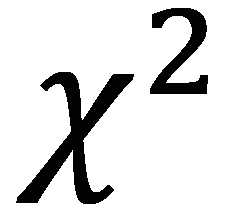
Summary Table: Choosing the Correct Test
Scenario | Test | Statistic |
|---|---|---|
Two proportions | 2-PropZTest | z |
Two means, unknown & unequal variances | 2-SampTTest (Welch) | t |
Two means, unknown & equal variances | Pooled t-test | t |
Two means, known variances | 2-SampZTest | z |
Matched pairs | Paired t-test | t |
Two variances | F-test | F |
Key Formulas
Difference in Proportions (z):
Difference in Means (t, unequal variances):
Difference in Means (z, known variances):
F-statistic:
Practice and Application
Practice problems in this chapter involve setting up hypotheses, checking conditions, calculating test statistics, and interpreting results for two-sample tests involving proportions, means, and variances. Use statistical calculators for efficient computation and to verify manual calculations.
