Back
BackIntroduction to Statistics and Collecting Data: Study Notes
Study Guide - Smart Notes
 Tailored notes based on your materials, expanded with key definitions, examples, and context.
Introduction to Statistics
Definition and Purpose of Statistics
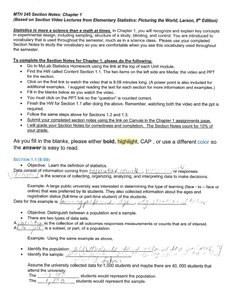
Statistics is the science of collecting, analyzing, interpreting, and presenting data. It is used to make informed decisions based on data from populations and samples.
Population: The entire group of individuals or items of interest.
Sample: A subset of the population, selected for study.
Objective: Distinguish between a population and a sample.
Example: If a university wants to study all students, the population is all students; a sample might be 400 students selected for a survey.
Parameters and Statistics
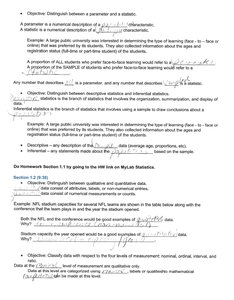
A parameter is a numerical description of a population characteristic, while a statistic is a numerical description of a sample characteristic.
Example: The average age of all students at a university is a parameter; the average age of a sample of students is a statistic.
Branches of Statistics
Descriptive vs. Inferential Statistics
Statistics is divided into two main branches:
Descriptive Statistics: Methods for organizing, summarizing, and displaying data.
Inferential Statistics: Methods for drawing conclusions about a population based on sample data.
Example: Calculating the mean test score of a sample is descriptive; using that mean to estimate the population mean is inferential.
Types of Data and Levels of Measurement
Qualitative vs. Quantitative Data
Data can be classified as:
Qualitative (Categorical): Describes qualities or categories (e.g., gender, color).
Quantitative (Numerical): Describes numerical values (e.g., height, age).
Levels of Measurement
There are four levels of measurement:
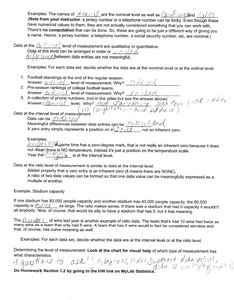
Nominal: Categories only, no order (e.g., names, colors).
Ordinal: Categories with a meaningful order, but no consistent difference between values (e.g., rankings).
Interval: Ordered, equal intervals, but no true zero (e.g., temperature in Celsius).
Ratio: Ordered, equal intervals, true zero exists (e.g., height, weight).
Examples of Levels of Measurement
Nominal: Football team names.
Ordinal: Class rankings.
Interval: SAT scores.
Ratio: Stadium seating capacity.
Designing Statistical Studies
Steps in Designing a Study
To design a statistical study:
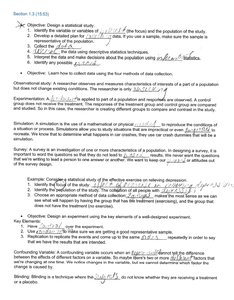
Identify the variable(s) of interest and the population.
Develop a plan for collecting data.
Collect the data.
Use descriptive statistics to summarize the data.
Interpret the data and draw conclusions using inferential statistics.
Types of Statistical Studies
Observational Study: Observes and measures characteristics without influencing them.
Experiment: Applies a treatment and observes its effect.
Simulation: Uses a model to reproduce conditions of a process or event.
Key Concepts in Experimental Design
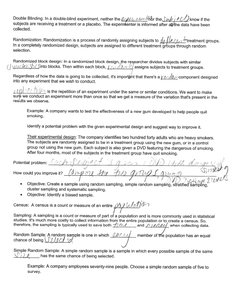
Confounding Variable: An outside variable that affects the results.
Blinding: Subjects do not know whether they are receiving a treatment or placebo.
Double Blinding: Neither subjects nor experimenters know who receives treatment or placebo.
Sampling Methods
Types of Sampling
Sampling is the process of selecting a subset of the population for study. Common methods include:
Random Sampling: Every member has an equal chance of being selected.
Stratified Sampling: Population divided into subgroups (strata), and random samples taken from each.
Cluster Sampling: Population divided into clusters, and entire clusters are randomly selected.
Systematic Sampling: Every nth member is selected.
Convenience Sampling: Members are chosen based on ease of access.
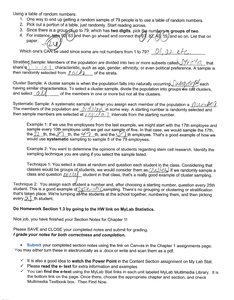
Using Random Numbers for Sampling
Pick a random starting point.
Use a table of random numbers to select members.
Ensure each member has an equal chance of selection.
Examples of Sampling Methods
Random: Choosing 5 employees from a list of 70 using random numbers.
Stratified: Dividing students by major and sampling from each group.
Cluster: Selecting entire classes as clusters.
Systematic: Selecting every 10th person from a list.
Convenience: Surveying people who are easy to reach.