 Back
BackIntroduction to Statistics: Foundations and Data Description
Study Guide - Smart Notes
 Tailored notes based on your materials, expanded with key definitions, examples, and context.
Statistics, Data, and Statistical Thinking
Introduction to Statistics
Statistics is the science of data, encompassing methods for designing research studies, describing collected data, and making decisions or inferences about phenomena represented by the data. It is essential for making informed decisions in various fields, including the social sciences, health, business, and engineering.
Designing Studies: Planning how to collect data to answer specific questions.
Describing Data: Summarizing and presenting data for interpretation.
Making Inferences: Drawing conclusions about populations based on sample data.
Applications: Examples include investigating the impact of COVID-19, comparing vaccine efficacy, and predicting exam marks based on midterm scores.
Branches of Statistics
Descriptive Statistics: Utilizes numerical and graphical methods to summarize and present data. Examples include mean, variance, range, frequency, histograms, and scatter plots.
Inferential Statistics: Uses sample data to make generalizations about a population, such as hypothesis testing and confidence intervals.
Fundamental Elements of Statistics
Experimental Unit: The object (person, thing, transaction, or event) about which data are collected.
Population: The complete set of all experimental units of interest.
Parameter: A summary measure describing a characteristic of the population.
Sample: A subset of the population, used when it is impractical to study the entire population.
Statistic: A summary measure computed from a sample, often used to estimate a population parameter.
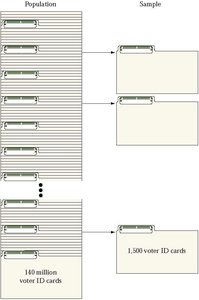
Inference: The process of using sample statistics to estimate population parameters.
Variables and Data Types
Variable: A characteristic or property of an individual unit in the population (e.g., age, gender, years of education).
Types of Data:
Qualitative (Categorical): Data values are categories (e.g., gender, major, marital status).
Quantitative (Numerical): Data values are numerical (e.g., age, salary, number of children).
Measurement Scales
Qualitative Data:
Nominal: Categories with no inherent order (e.g., gender, marital status).
Ordinal: Categories with a meaningful order (e.g., income level, education level).
Quantitative Data:
Discrete: Countable values (e.g., number of students, number of PCs).
Continuous: Measured on a continuous scale (e.g., weight, GPA).
Collecting Data: Sampling and Related Issues
Data Collection Methods
Published Source: Data from journals, books, newspapers, or reliable websites.
Designed Experiment: Studies where researchers control factors to observe effects.
Survey: Questionnaires or interviews to solicit information from people.
Observational Study: Observing and recording data without controlling factors.
Sampling Methods
Simple Random Sample: Every sample of size n has an equal chance of being selected.
Sample of Convenience: Not drawn by a well-defined random method; used when random sampling is not feasible.
Other Probability Sampling Designs: Systematic, stratified, and cluster sampling.
Representative Sample: Should exhibit characteristics typical of the population.
Types of Bias
Selection Bias: Some units in the population have no chance of being selected.
Nonresponse Bias: Data cannot be obtained from all selected units.
Measurement Error: Inaccuracies in recorded data, possibly due to ambiguous questions or interviewer effects.
Methods for Describing Sets of Data
Descriptive Statistics: Overview
Descriptive statistics involve arranging, summarizing, and presenting data to enable meaningful interpretation and support decision making. The methods used depend on the type of data (qualitative or quantitative).
Representing Qualitative Data
Frequency Table: Lists categories and the number of observations in each category.
Relative Frequency: Class frequency divided by the total number of observations.
Class Percentage: Relative frequency multiplied by 100.
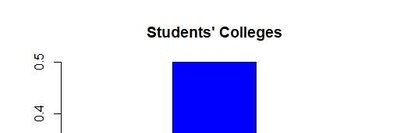
Bar Chart: Bars represent categories; height shows frequency or relative frequency.
Pareto Diagram: Bar chart with categories ordered by descending frequency.
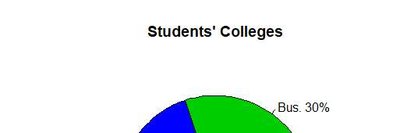
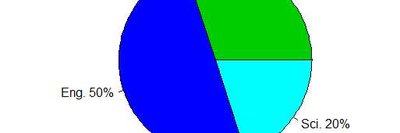
Pie Chart: Slices represent categories; size is proportional to relative frequency.

Representing Quantitative Data
Dot Plot: Dots represent individual data points along a number line; useful for small data sets.
Stem-and-Leaf Display: Shows original data values and distribution; best for small, not too spread-out data sets.
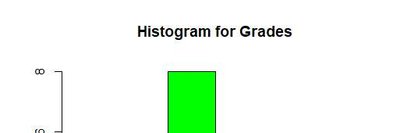
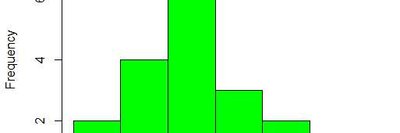
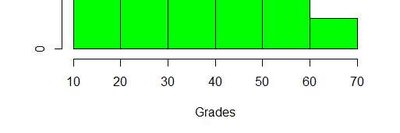
Histogram: Graph of frequency or relative frequency for class intervals; useful for larger data sets.
Shapes of Histograms
Symmetric: Right and left halves are mirror images.
Skewed Right (Positively Skewed): Longer right tail.
Skewed Left (Negatively Skewed): Longer left tail.
Unimodal: One peak.
Bimodal: Two distinct peaks.
Summation Notation
Summation notation is used to represent the sum of a set of values. For a sample data set :
Sum:
Sum of squares:
Square of the sum:
Numerical Measures of Central Tendency
Mean: The average of data values.
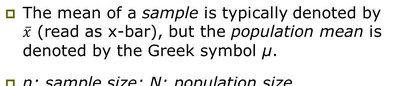
Sample mean:
Population mean:
Median: The middle value when data are ordered.
Mode: The value that occurs most frequently.
Example: The systolic blood pressure of seven men: 140, 124, 132, 180, 146, 124, 113. The sample mean is $137$.
Additional info:
Measures of variability (variance, standard deviation, range) and relative standing (percentiles, quartiles) are also important for describing data sets, but are covered in more detail in subsequent sections.
