 Back
BackIntroduction to Statistics: Foundations, Data Types, and Sampling Methods
Study Guide - Smart Notes
 Tailored notes based on your materials, expanded with key definitions, examples, and context.
Chapter 1: Introduction to Statistics
Section 1.1: Statistical and Critical Thinking
Statistics is the science of planning studies and experiments, collecting data, and then organizing, summarizing, presenting, analyzing, interpreting, and drawing conclusions based on the data. Critical thinking is essential in statistics to ensure that conclusions are justified and based on sound analysis.
Data: Collections of observations, such as measurements or survey responses.
Population: The complete collection of all individuals or measurements to be studied.
Census: Data collection from every member of the population.
Sample: A subcollection of members selected from the population.
Example: In a study of 38 million carbon monoxide detectors, a sample of 30 was tested, and 12 failed. The population is all 38 million detectors; the sample is the 30 tested.
Important Factors about Data
Context: Understanding what the data represent and their source is crucial for proper analysis.
Source: Consider whether the data source is objective or biased.
Sampling Method: The way data are collected affects the validity of conclusions. Voluntary response samples are often biased.
Conclusion: Conclusions should be clear and justified by the analysis, avoiding unwarranted causal claims.
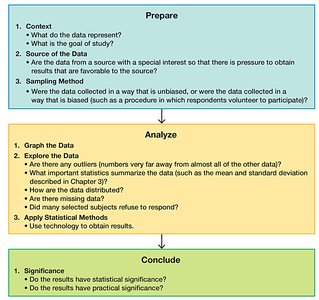
Statistical significance: Achieved when a result is very unlikely to occur by chance (typically, probability ≤ 5%).
Practical significance: Even if a result is statistically significant, it may not be large enough to be of practical importance.
Example: A drug may show a statistically significant effect, but if the improvement is minimal, it may lack practical significance.
Section 1.2: Types of Data
Understanding the types of data is essential for choosing appropriate statistical methods.
Parameter: A numerical measure describing a characteristic of a population.
Statistic: A numerical measure describing a characteristic of a sample.
Example: If a sample of students has a mean absence of 3.5 days, this is a statistic. If all students have a mean absence of 4.5 days, this is a parameter.
Qualitative vs. Quantitative Data
Quantitative data: Numbers representing counts or measurements.
Qualitative (categorical) data: Names or labels that can be separated into categories.
Types of Quantitative Data
Discrete data: Finite or countable values (e.g., number of students).
Continuous data: Infinite possible values on a continuous scale (e.g., height, weight).
Levels of Measurement
Nominal: Names, labels, or categories only; cannot be ordered (e.g., social security numbers).
Ordinal: Can be ordered, but differences are not meaningful (e.g., rankings).
Interval: Ordered, meaningful differences, but no natural zero (e.g., temperatures in Fahrenheit).
Ratio: Ordered, meaningful differences, and a natural zero (e.g., income, distance).
Example: Baking temperatures are interval; incomes are ratio; social security numbers are nominal.
Section 1.3: Collecting Sample Data
Proper data collection is fundamental to valid statistical inference. The 'gold standard' in experiments is randomization with placebo/treatment groups.
Placebo: A harmless, ineffective treatment used for comparison.
Observational study: Observing and measuring characteristics without modifying subjects.
Experiment: Applying a treatment and observing its effects.
Example: The Salk vaccine trial randomly assigned children to vaccine or placebo groups to test effectiveness.
Design of Experiments
Replication: Repeating an experiment on multiple subjects to ensure reliability.
Blinding: Subjects do not know if they receive treatment or placebo; double-blind means both subjects and experimenters are unaware.
Randomness: Assigning subjects to groups by chance to create comparable groups.
Sampling Methods
Simple random sample: Every possible sample of size n has the same chance of being chosen.
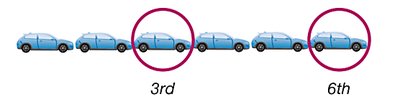
Systematic sampling: Select a starting point, then every kth element (e.g., every 3rd car).
Convenience sampling: Using data that are easy to obtain (e.g., surveying people nearby).

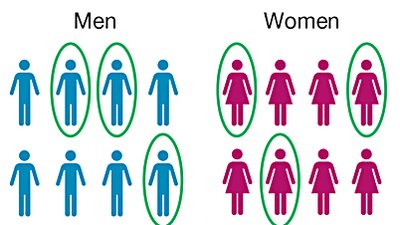
Stratified sampling: Subdivide the population into subgroups (strata) with shared characteristics, then sample from each subgroup.
Cluster sampling: Divide the population into sections (clusters), randomly select clusters, and include all members from selected clusters.

Multistage sampling: Combining several sampling methods in stages.
Sampling Errors
Sampling error: Random sample fluctuations causing discrepancies between sample and population results.
Non-sampling error: Human errors such as data entry mistakes, biased questions, or inappropriate statistical methods.
Nonrandom sampling error: Errors from using nonrandom sampling methods (e.g., convenience or voluntary response samples).
