 Back
BackLinear Regression: Correlation and Regression in Statistics
Study Guide - Smart Notes
 Tailored notes based on your materials, expanded with key definitions, examples, and context.
Correlation and Regression
Introduction to Linear Regression
Linear regression is a statistical method used to model the relationship between two quantitative variables. After establishing that a significant linear correlation exists between the variables, the next step is to determine the equation of the regression line, which can be used to predict values of the dependent variable based on the independent variable.
Regression Line: The line that best fits the data, minimizing the sum of the squares of the residuals.
Prediction: The regression equation allows prediction of the dependent variable (y) for a given independent variable (x).
Residuals
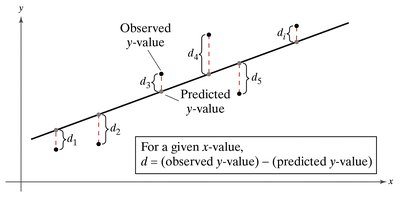
Residuals are the differences between observed and predicted values for each data point. They are crucial for assessing the accuracy of the regression model.
Definition: For each data point, the residual (di) is the difference between the observed y-value and the predicted y-value for a given x-value.
Interpretation: Residuals can be positive, negative, or zero, indicating whether the model overestimates or underestimates the actual value.
Minimization: The regression line is chosen so that the sum of the squares of the residuals is minimized.
Equation of the Regression Line
The regression line is mathematically defined by its slope and y-intercept. The formula for the regression line is:
General Form:
Slope (m):
Y-intercept (b):
Mean Values: and are the means of the x-values and y-values, respectively.
Line Passes Through: The regression line always passes through the point .
Example 1: Finding the Regression Line
Given data on children's ages and vocabulary sizes, the regression line can be calculated using the formulas above. For the provided data:
Data: Ages (x) and vocabulary sizes (y) for 11 children.
Calculated Values: , , , ,
Slope:
Y-intercept:
Regression Equation:
Sketching the Regression Line
To visualize the regression line, select two x-values within the data range, calculate their corresponding y-values using the regression equation, and draw a line through these points. The line will pass through the mean point .
Predicting y-Values Using Regression Equations
The regression equation can be used to predict the dependent variable for any given value of the independent variable.
Example: For children's age x = 3.5 years,
Example: For x = 5.6 years,
Using Technology (Excel) to Find Regression Equations
Statistical software such as Excel can be used to compute regression equations and visualize data with scatter plots and trend lines.
Procedure: Use Excel's Data Analysis tool to perform regression analysis.
Example: For age and systolic blood pressure data, the regression equation is
Prediction: For x = 30 years,
Prediction: For x = 60 years,
Example 3: Regression with Building Heights and Stories
Regression analysis can be applied to various fields, such as architecture, to predict the number of stories in a building based on its height.
Regression Equation:
Prediction: For x = 499 ft,
Prediction: For x = 724 ft,
Summary Table: Regression Line Components
Component | Formula | Description |
|---|---|---|
Regression Line | Predicts y for a given x | |
Slope (m) | Rate of change of y with respect to x | |
Y-intercept (b) | Value of y when x = 0 | |
Residual (d) | Difference between actual and predicted y |
Additional info: Academic context and formulas have been expanded for clarity and completeness. Examples and applications are provided to reinforce understanding of regression analysis in statistics.
