 Back
BackL8 Normal Probability Distribution: Concepts, Calculations, and Applications
Study Guide - Smart Notes
 Tailored notes based on your materials, expanded with key definitions, examples, and context.
Normal Probability Distribution
Continuous Random Variables
Continuous random variables are variables that can take any real value within a given interval. Unlike discrete random variables, their possible values cannot be listed individually, as there are infinitely many within any range.
Definition: A continuous random variable is one whose set of possible values forms an interval or collection of intervals on the real number line.
Examples: Height, weight, age, time, temperature, pressure, pH.
Probability: The probability of a continuous random variable taking any exact value is zero, i.e., . Instead, probabilities are calculated over intervals: , , .
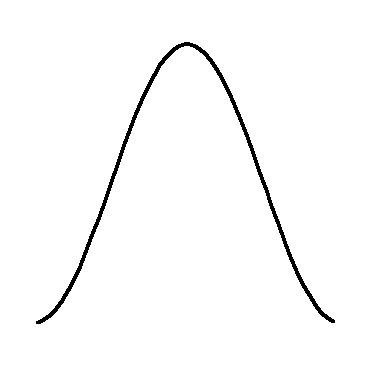
Density Curves
Density curves are graphical representations of the probability distribution of a continuous random variable. The area under the curve represents probability, and the total area is always 1.
Key Point: The density curve is used to model the distribution of continuous random variables.
Total Area: The total area under the density curve equals 1.

The Normal Distribution
The normal probability distribution is a fundamental continuous distribution characterized by its mean () and standard deviation (). It is widely used in statistics due to its natural occurrence in many real-world phenomena.
Definition: The normal distribution is a symmetric, bell-shaped distribution defined by its mean and standard deviation.
Characteristics:
The mean is at the center, and mean = mode = median.
The curve is symmetric and bell-shaped.
The standard deviation determines the width of the curve.
Total area under the curve is 1.
Formula: The probability density function (PDF) of the normal distribution is:
Standard Normal Distribution and Z-Scores
The standard normal distribution is a special case of the normal distribution with mean 0 and standard deviation 1. Z-scores are used to standardize values from any normal distribution.
Definition: The standard normal distribution has and .
Z-score: The Z-score transforms any normal variable to the standard normal:
Z-table: The Z-table provides probabilities for the standard normal distribution.

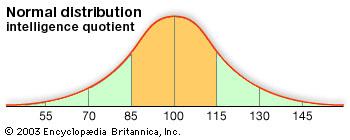
Empirical Rule (68-95-99.7 Rule)
The empirical rule describes the proportion of values within certain standard deviations from the mean in a normal distribution.
68%: Within 1 standard deviation ()
95%: Within 1.96 standard deviations ()
99.7%: Within 3 standard deviations ()

Calculating Probabilities Using the Normal Distribution
Probabilities for intervals or specific values can be calculated using the normal distribution and Z-scores.
Transforming to Z: Use to convert any value to the standard normal.
Example: For IQ scores with , , the percentage above 130 is found by calculating and using the Z-table.
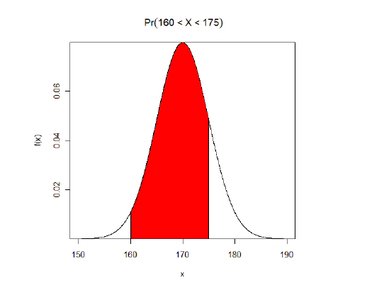
Interval Probability: is the area under the curve between and .
Applications of the Normal Distribution
The normal distribution is used in various statistical applications, including quality control, medical statistics, and employee appraisals.
Control Charts: Used to monitor processes; most values fall within 3 standard deviations of the mean.
Upper Control Limit (UCL):
Lower Control Limit (LCL):
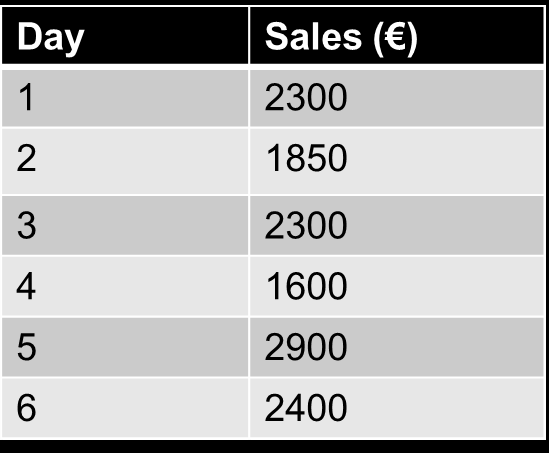
Example: Daily sales with , ; values outside UCL or LCL are unusual.

Day | Sales (€) |
|---|---|
1 | 2300 |
2 | 1850 |
3 | 2300 |
4 | 1600 |
5 | 2900 |
6 | 2400 |
Using Z-values to Identify Unusual Cases
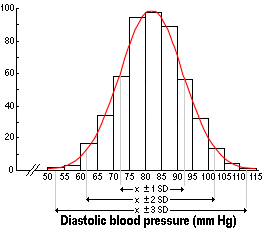
Z-values allow comparison of individual cases to the population, identifying outliers or unusual values.
Example: Diastolic blood pressure in adult males ( mm Hg, mm Hg). A patient with 125 mm Hg has , which is highly unusual.
Employee Appraisals and Forced Ranking
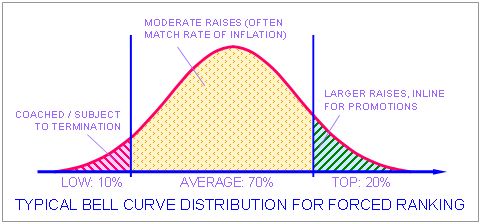
Normal distribution is sometimes used in employee appraisals for large groups, but is less useful for small teams.
Application: Forced ranking systems assume employee performance follows a normal distribution.
Summary
Normal distribution is defined by its mean and standard deviation.
Z-table gives probabilities for the standard normal distribution.
Any normal distribution value can be transformed to a z-value using .
