 Back
Back6.2 Normal Probability Distributions: Real Applications and Methods
Study Guide - Smart Notes
 Tailored notes based on your materials, expanded with key definitions, examples, and context.
Normal Probability Distributions
Introduction to Nonstandard Normal Distributions
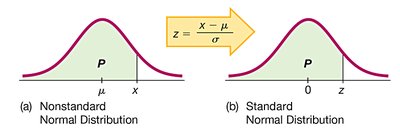
Normal distributions are fundamental in statistics, describing many real-world phenomena. While the standard normal distribution has a mean of 0 and a standard deviation of 1, most practical applications involve distributions with different means and standard deviations. To analyze these, we use a conversion formula to standardize values, enabling the use of standard normal tables and methods.
Normal Distribution: A symmetric, bell-shaped curve defined by its mean (μ) and standard deviation (σ).
Standard Normal Distribution: A special case where μ = 0 and σ = 1.
Standardization: The process of converting any normal distribution to the standard normal distribution using z scores.
Standardization and the Z Score Formula
To compare values from different normal distributions or to use standard normal tables, we convert raw scores (x) to z scores. The z score represents the number of standard deviations a value is from the mean.
Z Score Formula:
Interpretation: Positive z scores indicate values above the mean; negative z scores indicate values below the mean.
Rounding: Z scores are typically rounded to two decimal places for table lookup.
Finding Areas (Probabilities) with Nonstandard Normal Distributions
To find probabilities for values in a nonstandard normal distribution, follow these steps:
Sketch the normal curve, label the mean and relevant x values, and shade the region representing the desired probability.
Convert x values to z scores using the formula above.
Use technology (e.g., Excel's NORM.DIST function) or Table A-2 to find the area under the curve corresponding to the z score.
The area represents the probability of the event.
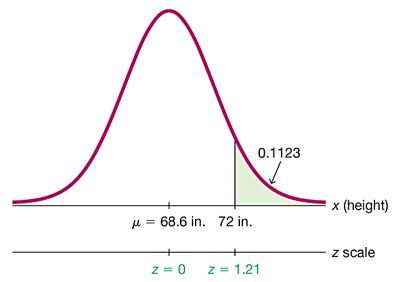
Example: Proportion of Men Taller Than a Showerhead
Suppose heights of men are normally distributed with a mean of 68.6 inches and a standard deviation of 2.8 inches. To find the percentage of men taller than a showerhead at 72 inches:
Step 1: Sketch the distribution and shade the region to the right of 72 inches.
Step 2: Convert 72 inches to a z score:
Step 3: Use technology or Table A-2 to find the area to the right of z = 1.21. The area is 0.1123, or 11.23%.
Interpretation: About 11% of men are taller than the showerhead, indicating the design may not be suitable for all.
Finding Values from Known Areas (Probabilities)
Sometimes, the area (probability or percentage) is known, and the corresponding value (x) must be found. This is common in design and quality control applications.
Step 1: Sketch the normal curve and shade the region representing the given probability.
Step 2: Use technology or Table A-2 to find the z score corresponding to the cumulative area.
Step 3: Convert the z score to the x value using the formula:
Step 4: Verify the solution in the context of the graph and problem.
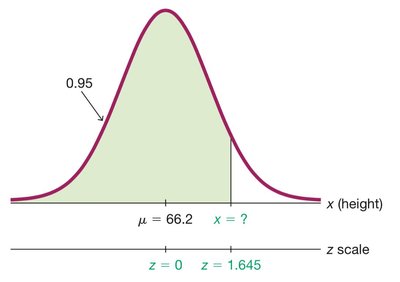
Example: Designing a Front Door for a Home
To design a door that accommodates at least 95% of adults, assume heights are normally distributed with a mean of 66.2 inches and a standard deviation of 3.8 inches. Find the door height for the shortest 95% of adults:
Step 1: Sketch the distribution and shade the region representing 95% from the left.
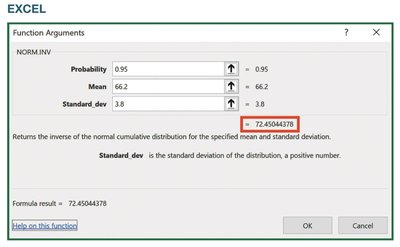
Step 2: Use Excel's NORM.INV function or Table A-2 to find the z score for 0.9500 cumulative area. Table A-2 gives z = 1.645.
Step 3: Calculate the x value:
Interpretation: A door height of 72.5 inches would allow 95% of adults to walk through without bending. The standard door height of 80 inches exceeds this requirement, so more than 95% of adults are accommodated.

Helpful Hints for Working with Normal Distributions
Graphs: Always use graphs to visualize the problem.
Z Scores vs. Areas: Z scores are positions on the horizontal axis; areas are regions under the curve.
Right/Left Side: Choose the correct side of the graph based on the problem context.
Negative Z Scores: Z scores are negative for values on the left side of the mean.
Probability Range: Probabilities are always between 0 and 1.
Summary Table: Key Formulas for Normal Distributions
Formula | Purpose |
|---|---|
Convert x to z score | |
Find x from z score |
