 Back
BackL12 P-values, Independent Samples Tests, and A/B Testing in Statistics
Study Guide - Smart Notes
 Tailored notes based on your materials, expanded with key definitions, examples, and context.
P-values and Hypothesis Testing
Understanding P-values
P-values are a fundamental concept in hypothesis testing, representing the probability of obtaining results at least as extreme as those observed, assuming the null hypothesis is true. They help determine the statistical significance of the observed effect.
P-value: The probability of finding the observed, or more extreme, data when the null hypothesis is true.
Decision Rule: If the p-value is less than the significance level (commonly 0.05), reject the null hypothesis in favor of the alternative hypothesis.
Interpretation: A small p-value indicates strong evidence against the null hypothesis.
Example: Testing a Population Mean
Suppose a pharmacy wants to test if the mean number of items dispensed per day has increased beyond a target of 165. A sample of 35 days yields a mean of 172.6 and a standard deviation of 16.2. The hypotheses are:
Null hypothesis (H0):
Alternative hypothesis (Ha):
Significance level:
The test statistic is calculated as:
Substituting the values:
Since 2.77 > 1.96 (critical value for ), we reject the null hypothesis. The p-value for is approximately 0.0056, indicating strong evidence against .
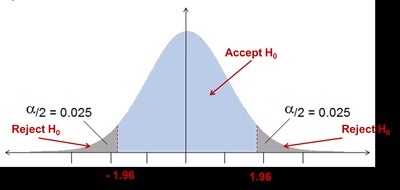
Critical Values and Rejection Regions
Critical values define the boundaries of the acceptance and rejection regions for a hypothesis test. For a two-tailed test at , the critical values are ±1.96.
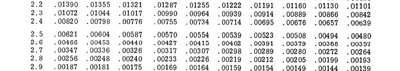
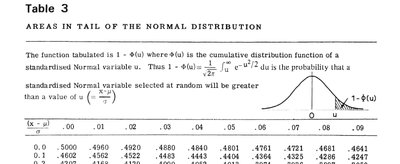
Using Z-tables to Find P-values
Z-tables provide the probability of observing a value greater than a given z-score under the standard normal distribution. These tables are essential for determining p-values in hypothesis testing.
Statistical Inference About Means with Two Populations
Types of Tests
Independent Samples Test: Compares means between two distinct groups (e.g., job satisfaction between accountants and HR personnel).
Paired Data Test: Compares means from the same group at two different time points (e.g., before and after a training intervention).
Independent Samples Z-test
This test evaluates whether there is a significant difference between the means of two independent groups. The hypotheses are:
Null hypothesis (H0):
Alternative hypothesis (Ha):
The test statistic is:
Where are sample means, are standard deviations, and are sample sizes.
Example: Comparing Two Products
A business wants to compare customer ratings for two products:
Product A | Product B | |
|---|---|---|
Mean | 6.7 | 7.8 |
Standard deviation | 2.3 | 1.4 |
Sample size | 38 | 36 |
Test statistic:
Since -2.5 < -1.96, we reject . The p-value is approximately 0.012, indicating a significant difference in ratings.

Confidence Interval for the Difference in Means
A 95% confidence interval estimates the range in which the true difference in population means lies:
For the example above:
This interval suggests that Product B is rated significantly higher than Product A.
A/B Testing
Definition and Application
A/B testing (or split testing) is a method used to compare two versions of a product or process to determine which performs better. Users are randomly assigned to either a test group (A) or a control group (B), and outcomes are compared.

Example: An online store tests whether a new promotional email (A) leads to higher spending than the current email (B). Customers are randomly assigned to each group, and spending is compared using the independent samples z-test.
Group A | Group B | |
|---|---|---|
Mean | 147.8 | 126.7 |
Standard deviation | 10.4 | 6.3 |
Sample size | 100 | 100 |
Summary
P-values: Probability of observing the data (or more extreme) if the null hypothesis is true. Typically, reject if p-value < 0.05.
Independent samples z-test: Used to test the difference in means between two groups.
A/B testing: A practical application of independent samples testing to compare two versions of a process or product.
