 Back
BackProbability Distributions and Estimation in Elementary Statistics
Study Guide - Smart Notes
 Tailored notes based on your materials, expanded with key definitions, examples, and context.
Probability Distributions
Introduction to Probability
Probability is the measure of the likelihood that an event will occur. It is not a guarantee but a quantification of uncertainty. For example, a 20% chance of rain does not mean it will definitely rain or not rain; it simply expresses the likelihood.
Probability values range from 0 (impossible) to 1 (certain).
Random Variables and Probability Distributions
A random variable is a variable whose value is determined by chance. Probability distributions describe the probabilities for each value of a random variable.
Discrete random variable: Takes countable values (e.g., number of heads in coin tosses).
Continuous random variable: Takes infinitely many values, not countable (e.g., body temperature).
Requirements for Probability Distributions
Random variable x is numerical and associated with probabilities.
The sum of all probabilities is 1:
Each probability is between 0 and 1:
Example: Probability Distribution for Two Births
Let x = number of females in two births. The probability distribution is:
x | P(x) |
|---|---|
0 | 0.25 |
1 | 0.50 |
2 | 0.25 |
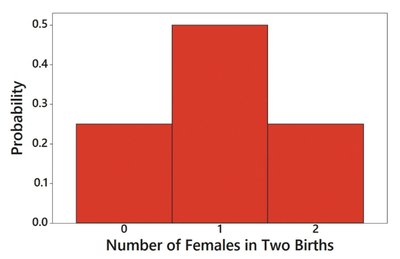
Probability Histogram
A probability histogram visually represents a probability distribution, with the vertical axis showing probabilities.
Parameters of a Probability Distribution
Mean (μ):
Variance (σ²): or
Standard deviation (σ):
Expected value (E):
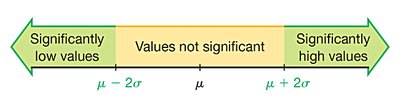
Significant Values and the Range Rule of Thumb
To identify significantly low or high values:
Significantly low: or lower
Significantly high: or higher
Not significant: Between and
Binomial Probability Distributions
Definition and Requirements
A binomial probability distribution arises from a procedure with:
Fixed number of trials (n)
Independent trials
Two possible outcomes per trial (success/failure)
Constant probability of success (p) and failure (q = 1 - p)
Notation
n: Number of trials
x: Number of successes
p: Probability of success
q: Probability of failure
P(x): Probability of exactly x successes
Binomial Probability Formula
The probability of getting exactly x successes in n trials:
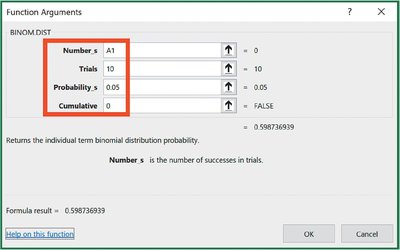
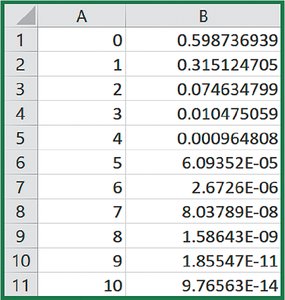
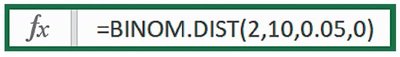
Finding Binomial Probabilities Using Technology
Excel and other software can compute binomial probabilities efficiently.
Mean and Standard Deviation of Binomial Distributions
Mean:
Variance:
Standard deviation:
Normal Probability Distributions
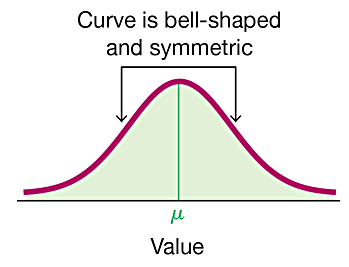
Standard Normal Distribution
The standard normal distribution is a bell-shaped, symmetric distribution with mean 0 and standard deviation 1. Probabilities correspond to areas under the curve.
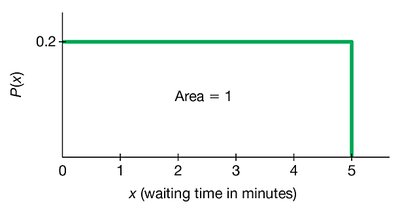
Uniform Distribution
A uniform distribution has values equally spread over the range, resulting in a rectangular graph. The area under the curve equals 1.

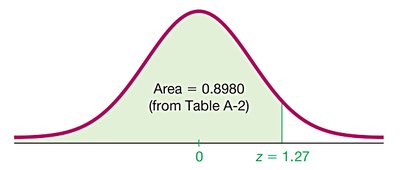
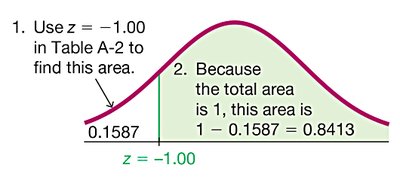
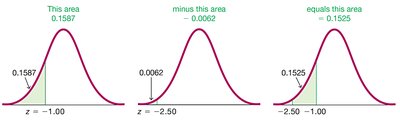
Finding Probabilities with z Scores
z score:
Use technology or tables to find areas (probabilities) for regions under the normal curve.

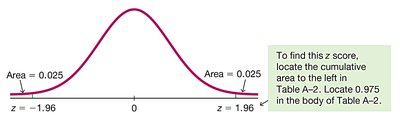
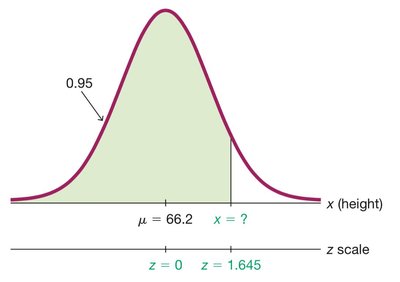
Critical Values
Critical values are z scores that separate significant from non-significant results. For a 95% confidence level, the critical value is .
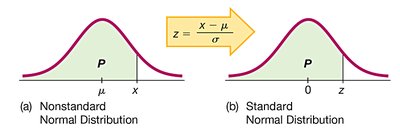
Converting Nonstandard to Standard Normal Distributions
Any normal distribution can be standardized using the z score formula:
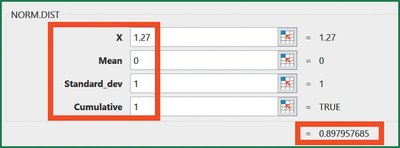
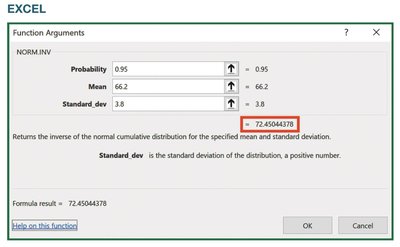
Finding Values from Known Areas
Given a probability (area), use the inverse normal function (e.g., Excel's NORM.INV) to find the corresponding x value.
Estimating Parameters and Determining Sample Sizes
Estimating a Population Proportion
Point estimate: The sample proportion is the best estimate of the population proportion p.
Confidence interval: A range of values likely to contain the population parameter.
Margin of error (E):
Confidence interval for p:
Confidence Level | α | Critical Value |
|---|---|---|
90% | 0.10 | 1.645 |
95% | 0.05 | 1.96 |
99% | 0.01 | 2.575 |
Determining Sample Size for Proportions
If is known:
If is unknown:
Always round up to the next whole number.
Estimating a Population Mean (σ Not Known)
Point estimate: The sample mean is the best estimate of the population mean μ.
Confidence interval:
Margin of error (E): (use t-distribution with df = n - 1)
Determining Sample Size for Means
If σ is unknown, estimate using range/4 or prior studies.
Summary Table: Choosing the Correct Distribution
Condition | Method |
|---|---|
σ not known, normal population or n > 30 | Student t distribution |
σ known, normal population or n > 30 | Normal (z) distribution |
Population not normal, n ≤ 30 | Nonparametric or bootstrapping methods |
Key Terms and Concepts
Random variable: Variable whose value is determined by chance.
Probability distribution: Table, formula, or graph showing probabilities for each value of a random variable.
Binomial distribution: Probability distribution for a fixed number of independent trials with two outcomes.
Normal distribution: Symmetric, bell-shaped distribution described by mean and standard deviation.
Confidence interval: Range of values used to estimate a population parameter.
Margin of error: Maximum likely difference between sample statistic and population parameter.
Critical value: Value that separates significant from non-significant results in hypothesis testing or estimation.
