 Back
BackProbability Distributions: Concepts, Calculations, and Applications
Study Guide - Smart Notes
 Tailored notes based on your materials, expanded with key definitions, examples, and context.
Probability Distributions
Random Variables
A random variable is a variable, typically denoted by x, that assumes a single numerical value determined by chance for each outcome of a random process.
Discrete Random Variable: Takes on a finite or countable number of values (e.g., number of heads in coin tosses).
Continuous Random Variable: Takes on infinitely many values, not countable, often measured on a continuous scale (e.g., body temperature).
Probability Distributions
A probability distribution provides the probability for each value of a random variable. It can be represented as a table, formula, or graph.
Each value of the random variable is associated with a probability.
The sum of all probabilities must be 1:
Each probability must satisfy
Example: Probability Distribution for Number of Females in Two Births
Suppose two babies are born. Let x be the number of females. The possible values are 0, 1, or 2. The probability distribution is:
P(0) = 0.25
P(1) = 0.50
P(2) = 0.25
This distribution satisfies all requirements: numerical variable, probabilities sum to 1, and each probability is between 0 and 1.
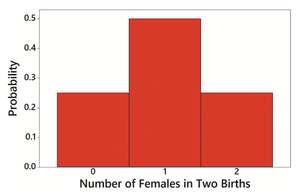
Probability Histogram
A probability histogram visually represents a probability distribution. The vertical axis shows probabilities, and the horizontal axis shows the values of the random variable.
Probability Distribution Table Example
x (Number of Females) | P(x) |
|---|---|
0 | 0.25 |
1 | 0.50 |
2 | 0.25 |
Parameters of a Probability Distribution
Mean, Variance, and Standard Deviation
For a discrete probability distribution, the mean (expected value), variance, and standard deviation are calculated as follows:
Mean (Expected Value):
Variance:
Standard Deviation:
These formulas describe the population parameters for the distribution.
Example Calculation
F nor the two-birth example:
Mean:
Variance:
Standard Deviation:
The expected value is the same as the mean: 1.0 female.
Identifying Significant Results
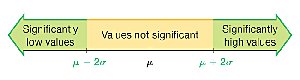
Range Rule of Thumb
The range rule of thumb helps identify significantly low or high values in a probability distribution:
Significantly low values: or lower
Significantly high values: or higher
Values not significant: Between and
Example: Applying the Range Rule of Thumb
For two births, , :
2 females is not significantly high, since 2 < 2.4
Identifying Significant Results with Probabilities
Significantly high:
Significantly low:
The threshold 0.05 is common but not absolute; sometimes 0.01 is used.
Rare Event Rule for Inferential Statistics
If, under a given assumption, the probability of an observed outcome is very small, and the outcome is significantly less or more than expected, we conclude the assumption is probably incorrect.
Expected Value and Applications
Expected Value
The expected value of a random variable is the mean of its probability distribution. It represents the long-term average outcome of a random process.
Example: Gambling Decisions
Roulette: Bet \frac{37}{38}\frac{1}{38}$.
Craps: Bet \frac{251}{495}\frac{244}{495}$.
Calculate expected value for each bet:
Roulette: (−26¢)
Craps: (−7¢)
Conclusion: The craps bet is better in the long run, as it has a higher expected value (smaller expected loss).
Summary Table: Probability Distribution Requirements
Requirement | Description |
|---|---|
Numerical Random Variable | Variable x must be numerical, not categorical |
Sum of Probabilities | (allowing for rounding error) |
Probability Range | Each must satisfy |
