 Back
BackRandomness, Sampling, and Experimental Design in Statistics
Study Guide - Smart Notes
 Tailored notes based on your materials, expanded with key definitions, examples, and context.
Understanding Randomness
Why Be Random?
Randomness is a fundamental concept in statistics, ensuring fairness and unpredictability in outcomes. Statisticians use randomness as a tool to model real-world processes and to draw unbiased conclusions from data.
Fairness: Random selection means no one can predict the outcome in advance.
Equally Likely Outcomes: In fair random processes, each possible outcome has the same probability.
Example: Flipping a fair coin to decide between "heads" or "tails" demonstrates randomness.
Generating Random Values
True randomness is difficult to achieve, even with computers. Most computer-generated random numbers are pseudorandom, meaning they are determined by algorithms but sufficiently unpredictable for most statistical purposes.
Pseudorandom Numbers: Generated by computers, not truly random but adequate for simulations.
True Randomness: Can be achieved through physical randomizing devices or specialized algorithms.
Simulations in Statistics
Simulations are used to imitate real processes, allowing statisticians to manipulate and control variables in a model. This is especially useful when collecting real data is impractical or impossible.
Trial: The sequence of events being investigated.
Component: The basic building block of a simulation.
Response Variable: The outcome recorded after each trial.
Steps for Running a Simulation
Identify the component to be repeated.
Explain how to model the component’s outcome.
Combine components to model a trial.
State the response variable clearly.
Run several trials and analyze the response variable.
Common Pitfalls in Simulations
Do not overstate conclusions from simulations.
Model outcome chances accurately.
Run enough trials to ensure reliability.
Sampling and Surveys
Population vs Sample
In statistics, a population is the entire group of individuals or instances we want to study, while a sample is a subset of the population used to make inferences about the whole.
Population: All individuals of interest.
Sample: Representative subset of the population.
Surveys: Common method for collecting data from samples.
Parameters vs Statistics
Statistics are summaries calculated from sample data, while parameters are summaries describing the population. The goal is to use statistics to estimate parameters.
Parameter: A numerical summary of a population (e.g., mean, proportion).
Statistic: A numerical summary of a sample.
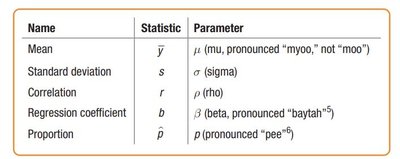
Name | Statistic | Parameter |
|---|---|---|
Mean | ||
Standard deviation | ||
Correlation | ||
Regression coefficient | ||
Proportion |
Bias in Sampling
Bias occurs when certain characteristics are over- or underrepresented in a sample, leading to inaccurate conclusions.
Voluntary Response: Only those who choose to respond are counted.
Convenience Sampling: Selecting individuals who are easiest to reach.
Undercoverage: Some groups are not represented proportionally.
Nonresponse Bias: Differences between those who respond and those who do not.
Response Bias: Survey design influences answers.
Randomization and Sampling Methods
Randomization is essential for reducing bias. Several sampling methods are used to ensure representative samples:
Simple Random Sampling (SRS): Every individual has an equal chance of being selected.
Stratified Random Sampling: Population divided into homogeneous groups (strata), SRS within each stratum.
Cluster Sampling: Population split into heterogeneous clusters, SRS of clusters, census within selected clusters.
Systematic Sampling: Select every nth individual after a random start.
Multistage Sampling: Combination of multiple methods.
Survey Design Considerations
Use clear, unbiased questions.
Quantitative answers are more powerful than categorical.
Pilot studies help identify potential issues before full-scale surveys.
Experiments and Observational Studies
Observational Studies
In observational studies, researchers do not assign treatments but simply observe choices and outcomes. These studies can be retrospective (looking at past data) or prospective (collecting data as events unfold).
Cannot establish causality.
Useful for discovering trends and relationships.
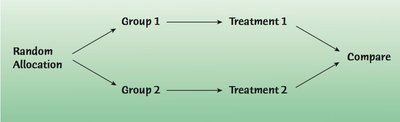
Randomized, Comparative Experiments
Experiments allow researchers to establish cause-and-effect relationships by manipulating factors and randomly assigning treatments.
Explanatory Variable (Factor): Variable manipulated by the experimenter.
Response Variable: Outcome measured.
Treatment: Combination of factor levels assigned to experimental units.
Experimental Units: Individuals or objects studied (called subjects if human).
Principles of Experimental Design
Control: Make conditions as similar as possible for all groups.
Randomize: Randomly assign treatments to equalize effects of unknown variables.
Replicate: Repeat the experiment with multiple subjects to estimate variability.
Block: Group similar subjects and randomize within blocks to reduce variability.
Blocking in Experiments
Blocking is used to isolate variability due to differences between groups, allowing clearer comparison of treatment effects.
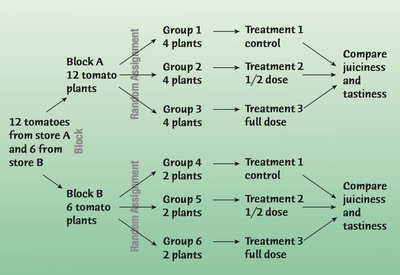
Randomized Block Design: Randomization occurs within blocks.
Matching: Pairing subjects with similar characteristics to reduce variability.
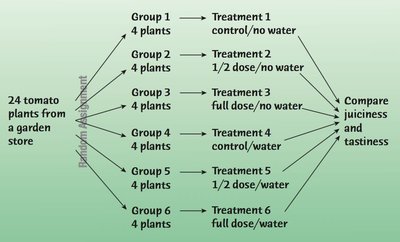
Adding More Factors
Experiments often include multiple factors to study their combined effects. This allows for more complex and informative designs.
Confounding and Lurking Variables
Confounding occurs when the effects of two factors cannot be separated. Lurking variables are variables not included in the study that may influence the response.
Confounding Variable: Associated with both the factor and the response, making it difficult to determine causality.
Lurking Variable: Not measured but may affect the relationship between variables.
Blinding and Placebos
Blinding prevents bias by ensuring subjects and/or evaluators do not know which treatment was assigned. Placebos are used to mimic treatments and control for the placebo effect.
Single-Blind: One class of individuals is blinded.
Double-Blind: Both subjects and evaluators are blinded.
Placebo Effect: Improvement due to receiving a sham treatment.
Best Practices in Experiments
Randomized, comparative, double-blind design with a control group is ideal.
Use blocking to reduce variability.
Report confounding and pilot results.
What Can Go Wrong?
Confounding can obscure results; use randomization and blocking to minimize.
Pilot studies help refine experimental design.
Record additional information to protect against unforeseen issues.
