 Back
BackSampling Distributions and the Central Limit Theorem: Study Notes
Study Guide - Smart Notes
 Tailored notes based on your materials, expanded with key definitions, examples, and context.
Sampling Distributions
Definition and Overview
The sampling distribution of a statistic (such as a sample proportion or sample mean) is the probability distribution of all possible values of that statistic when all possible samples of a fixed size n are drawn from the same population. Sampling distributions are fundamental in inferential statistics, as they allow us to understand the variability and behavior of sample statistics.
Statistic: A numerical measure calculated from a sample (e.g., sample mean, sample proportion).
Sampling Distribution: The distribution of a statistic over all possible samples of size n from a population.
Representation: Sampling distributions are often shown as probability histograms, formulas, or tables.
Sample Proportions
Definition
The sample proportion is the fraction of items in a sample that possess a certain characteristic. It is used to estimate the population proportion.
Notation: for sample proportion, for population proportion.
Formula: , where is the number of successes and is the sample size.
Behavior of Sample Proportions
The distribution of sample proportions tends to be normal when the sample size is large and the population proportion is not too close to 0 or 1. This is a result of the Central Limit Theorem.
Sample proportions target the value of the population proportion.
For large samples, the sampling distribution of is approximately normal with mean and standard deviation .
Sample Means
Definition
The sample mean is the average value of a sample and is used to estimate the population mean.
Notation: for sample mean, for population mean.
Formula:
Behavior of Sample Means
The distribution of sample means tends to be normal, especially as the sample size increases, regardless of the population's distribution. This is a key result of the Central Limit Theorem.
Sample means target the value of the population mean.
For large samples, the sampling distribution of is approximately normal with mean and standard deviation .
Sample Variances
Definition
The sample variance measures the spread of data in a sample and is used to estimate the population variance.
Notation: for sample variance, for population variance.
Formula:
Behavior of Sample Variances
The distribution of sample variances is typically skewed to the right and does not follow a normal distribution. The mean of the sample variances equals the population variance, but the distribution is not symmetric.
Sample variances target the value of the population variance.
Because the distribution is skewed, normal-based methods do not apply.
The Central Limit Theorem (CLT)
Definition and Importance
The Central Limit Theorem states that, for a sufficiently large sample size, the sampling distribution of the sample mean (or sample proportion) will be approximately normal, regardless of the population's distribution. This theorem is foundational for statistical inference.
Allows use of normal probability methods for inference about means and proportions.
Sample size is typically considered large if .
Mathematical Statement
If is a random variable with mean and standard deviation , then for samples of size :
The sampling distribution of has mean and standard deviation .
As increases, the distribution of approaches normality.
for large
Summary Table: Sampling Distributions
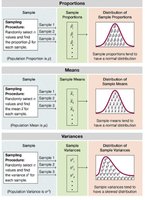
The following table summarizes the behavior of sampling distributions for proportions, means, and variances:
Statistic | Sampling Distribution Shape | Target Parameter | Notes |
|---|---|---|---|
Sample Proportion () | Approximately Normal | Population Proportion () | Normality improves with larger |
Sample Mean () | Approximately Normal | Population Mean () | Central Limit Theorem applies |
Sample Variance () | Skewed Right | Population Variance () | Not normal; mean equals |
