 Back
BackStatistical Inference: Comparing Two Means (Independent and Paired Samples)
Study Guide - Smart Notes
 Tailored notes based on your materials, expanded with key definitions, examples, and context.
Comparing Two Means: Statistical Inference
Introduction
Statistical inference for comparing two means is a fundamental topic in inferential statistics. It involves constructing confidence intervals and conducting hypothesis tests to determine whether there is a significant difference between the means of two groups. This is commonly applied in scientific research, such as comparing treatment and control groups, or, as in the provided example, comparing the masses of male and female turtles.
Confidence Intervals and Hypothesis Tests for Proportions and Means
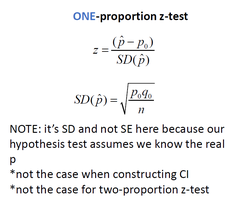
One-Proportion and Two-Proportion Z-Tests
When analyzing categorical data, we often compare proportions using z-tests. The one-proportion z-test is used to test hypotheses about a single population proportion, while the two-proportion z-test compares the proportions from two independent groups.
One-Proportion Z-Test: Tests whether a sample proportion differs from a hypothesized population proportion.
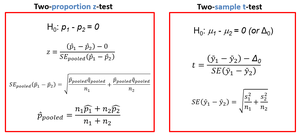
Two-Proportion Z-Test: Tests whether the proportions from two independent samples are significantly different.
Comparing Two Means: Independent Samples
Key Concepts
Independent Samples: Two groups are independent if the selection of individuals in one group does not influence the selection in the other group.
Sample Statistics vs. Population Parameters: Sample means and standard deviations are used to estimate the corresponding population parameters.
Example: Turtle Mass
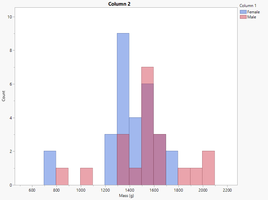
Suppose we want to compare the mean mass of male and female Blanding’s turtles. We collect data from two independent samples: 29 females and 20 males, recording their mean masses and standard deviations.

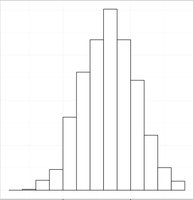
Visualizing the Data
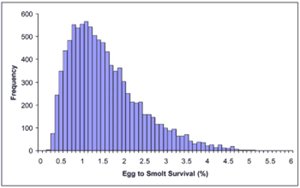
Histograms are useful for visualizing the distribution of sample data for each group. Overlapping histograms can help assess differences in central tendency and spread.
Assumptions and Conditions for Two-Sample t-Interval
Assumptions Checklist
Independence Assumption: The two groups must be independent.
Randomization Condition: Data should be collected via a simple random sample or randomized experiment.
10% Condition: Each sample should be less than 10% of its population.
Normal Population Assumption: The distribution of the variable should be nearly normal in each group, especially for small sample sizes.
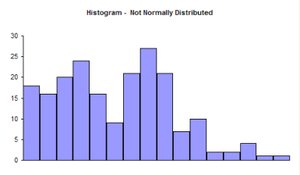
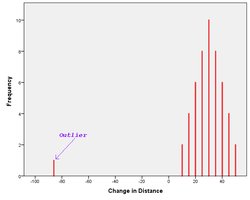
Violations of normality can be detected using histograms:
Multimodal Data: Data with multiple peaks.
Skewed Data: Data that is not symmetric.
Outliers: Extreme values that may affect the results.
Guidelines for Normality
If n < 10: Data must be normal (be cautious).
If n < 20: Some skewness is acceptable.
If n ≥ 20: Watch for outliers, extreme skewness, or multiple modes.
Two-Sample t-Interval (Confidence Interval for Difference of Means)
Formula and Calculation
The two-sample t-interval estimates the difference between two population means. The formula is:
Where the standard error is:
The degrees of freedom (df) for the t-distribution can be estimated using the smaller sample size minus one, or calculated exactly using:
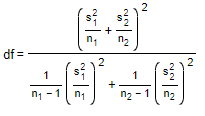
Using the exact df gives a narrower confidence interval, while the estimated df is more conservative (wider interval).
Interpreting the Confidence Interval
If the confidence interval for the difference in means includes zero, there is no significant evidence of a difference. If it does not include zero, there is evidence of a difference.
Two-Sample t-Test (Hypothesis Test for Difference of Means)
Hypotheses
Null Hypothesis (H0): (no difference)
Alternative Hypothesis (HA): (two-tailed), , or (one-tailed)
The test statistic is:
Where is the hypothesized difference (often zero).
P-Value and Decision
The p-value is the probability of observing a test statistic as extreme as, or more extreme than, the observed value under the null hypothesis. If the p-value is less than the significance level (commonly 0.05), we reject the null hypothesis.
Paired Data: Paired t-Test and Confidence Interval
When to Use Paired Tests
Paired data arise when the same subjects are measured twice (e.g., before and after treatment), or when observations are naturally paired (e.g., twins, matched subjects). The key is that the two samples are not independent.
Examples: Student rent before and after a policy change, plant density before and after treatment, animal size in consecutive years.

Analysis of Paired Data
For paired data, we analyze the differences within each pair. The paired t-test is essentially a one-sample t-test on these differences.
Sample size: Number of pairs
Tested mean: Mean of the pairwise differences
Assumptions for Paired t-Test
Independence: Pairs are independent of each other.
Randomization: Data collected randomly or via randomized experiment.
Normality: The distribution of the differences should be nearly normal (especially for small n).
Paired t Confidence Interval and Test
The confidence interval for the mean difference is:
The paired t-test statistic is:
Where is the mean of the differences, is the standard deviation of the differences, and is the number of pairs.
Example: Turtle Mass Before and After
Suppose we weigh the same turtles in two consecutive years and calculate the mean and standard deviation of the differences. We can construct a confidence interval and perform a hypothesis test to determine if there is a significant change in mass.
Summary Table: Comparing Two Means
Situation | Test/Interval | Assumptions | Formula |
|---|---|---|---|
Two independent samples | Two-sample t-test/interval | Independence, randomization, normality | |
Paired samples | Paired t-test/interval | Paired data, independence of pairs, normality of differences |
Key Takeaways
Use a two-sample t-test for comparing means of two independent groups.
Use a paired t-test for comparing means of paired or matched samples.
Always check assumptions before conducting inference.
Interpret confidence intervals and p-values in the context of the research question.
