 Back
BackStatistics Review: Measures, Boxplots, Normal Distribution, and Regression
Study Guide - Smart Notes
 Tailored notes based on your materials, expanded with key definitions, examples, and context.
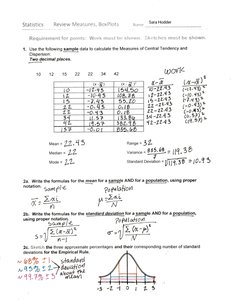
Q1. Calculate the Measures of Central Tendency and Dispersion for the given sample data.
Background
Topic: Measures of Central Tendency and Dispersion
This question tests your ability to compute the mean, median, mode, range, variance, and standard deviation for a set of sample data.
Key Terms and Formulas:
Mean ():
Median: The middle value when data is ordered
Mode: The value that appears most frequently
Range:
Variance (sample):
Standard Deviation (sample):
Step-by-Step Guidance
Order the data from smallest to largest to help find the median and mode.
Calculate the mean by summing all values and dividing by the number of data points.
Find the median by locating the middle value (or averaging the two middle values if the sample size is even).
Identify the mode by determining which value occurs most frequently.
Compute the range by subtracting the smallest value from the largest value.
Set up the formula for variance and standard deviation, but stop before plugging in the final values.
Try solving on your own before revealing the answer!
Final Answer:
Mean: 22.45, Median: 22, Mode: 32, Range: 32, Variance: 138.36, Standard Deviation: 11.77
Each measure was calculated using the appropriate formula and the ordered data set.
Q2. Write the formulas for the mean and standard deviation for a sample AND for a population, using proper notation.
Background
Topic: Statistical Notation and Formulas
This question tests your understanding of the difference between sample and population statistics, and your ability to use correct notation.
Key Terms and Formulas:
Sample mean:
Population mean:
Sample standard deviation:
Population standard deviation:
Step-by-Step Guidance
Write out the formula for the mean for both sample and population, noting the difference in notation ( vs ).
Write out the formula for standard deviation for both sample and population, noting the difference in denominator ( vs ).
Explain why the sample formula uses (Bessel's correction) and the population formula uses .
Try solving on your own before revealing the answer!
Final Answer:
Sample mean: , Population mean:
Sample standard deviation: , Population standard deviation:
Sample formulas use to correct for bias in estimating population parameters.
Q3. Use the Empirical Rule to estimate percentages and corresponding number of standard deviations for a normal distribution.
Background
Topic: Empirical Rule (68-95-99.7 Rule)
This question tests your understanding of the Empirical Rule, which describes the percentage of data within 1, 2, and 3 standard deviations of the mean in a normal distribution.
Key Terms and Formulas:
Empirical Rule: About 68% of data falls within 1 SD, 95% within 2 SD, and 99.7% within 3 SD of the mean.
Standard deviation (): Measure of spread in a normal distribution.
Step-by-Step Guidance
Draw or visualize a normal distribution curve.
Mark the mean and 1, 2, and 3 standard deviations from the mean.
Label the percentage of data within each interval according to the Empirical Rule.
Explain how to use these percentages to estimate probabilities or counts in a data set.
Try solving on your own before revealing the answer!
Final Answer:
68% within 1 SD, 95% within 2 SD, 99.7% within 3 SD of the mean.
These percentages help estimate the likelihood of a value falling within a certain range in a normal distribution.
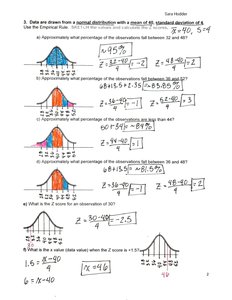
Q4. Data are drawn from a normal distribution with a mean of 40 and standard deviation of 6. Use the Empirical Rule to answer questions about percentages and Z-scores.
Background
Topic: Normal Distribution, Z-scores, Empirical Rule
This question tests your ability to use the Empirical Rule and Z-scores to estimate probabilities and percentages for values in a normal distribution.
Key Terms and Formulas:
Z-score:
Empirical Rule: See above.
Step-by-Step Guidance
Identify the mean () and standard deviation ().
Calculate Z-scores for the values in question using .
Use the Empirical Rule to estimate the percentage of observations within the specified Z-score range.
Shade or mark the relevant area under the normal curve to visualize the percentage.
Try solving on your own before revealing the answer!
Final Answer:
Percentages and Z-scores calculated for each range using the Empirical Rule and Z-score formula.
Shaded areas on the normal curve represent the estimated probabilities.
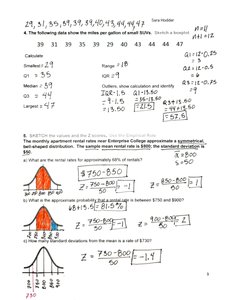
Q5. Calculate measures of central tendency and identify outliers for a data set showing miles per gallon of small SUVs.
Background
Topic: Measures of Central Tendency, Outlier Identification
This question tests your ability to compute mean, median, mode, range, and identify outliers using the interquartile range (IQR) method.
Key Terms and Formulas:
Mean, Median, Mode, Range: See above.
Interquartile Range (IQR):
Outlier: Any value less than or greater than
Step-by-Step Guidance
Order the data and calculate the mean, median, mode, and range.
Find the first quartile () and third quartile ().
Calculate the IQR and use it to determine the boundaries for outliers.
Identify any values outside these boundaries as outliers.
Try solving on your own before revealing the answer!
Final Answer:
Mean: 39, Median: 39, Mode: 39, Range: 18, Outliers identified using IQR method.
Outliers are values that fall outside the calculated boundaries.
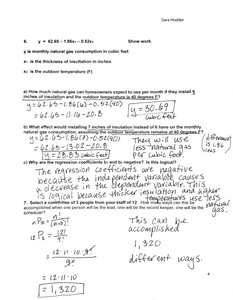
Q6. Use regression equation to predict monthly natural gas consumption based on insulation thickness and outdoor temperature.
Background
Topic: Linear Regression
This question tests your ability to use a regression equation to make predictions and interpret regression coefficients.
Key Terms and Formulas:
Regression equation:
: Predicted value (monthly gas consumption)
: Thickness of insulation
: Outdoor temperature
Step-by-Step Guidance
Identify the regression equation and the meaning of each variable and coefficient.
Plug in the given values for insulation thickness and outdoor temperature.
Set up the calculation for but stop before computing the final value.
Interpret the regression coefficients: explain how changes in and affect .
Try solving on your own before revealing the answer!
Final Answer:
Predicted gas consumption calculated using the regression equation.
Regression coefficients show the effect of insulation and temperature on gas consumption.
