 Back
BackStatistics Study Guide: Measures of Central Tendency, Probability, and Data Interpretation
Study Guide - Smart Notes
 Tailored notes based on your materials, expanded with key definitions, examples, and context.
Q4. For the distribution drawn here, identify the mean, median, and mode.
Background
Topic: Measures of Central Tendency in Skewed Distributions
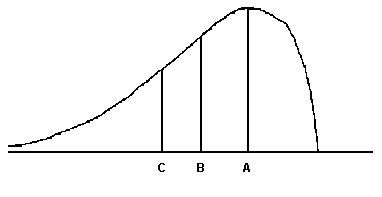
This question tests your understanding of how the mean, median, and mode are positioned in a skewed distribution. The image shows a right-skewed (positively skewed) distribution with three labeled points: A, B, and C.
Key Terms and Concepts:
Mean: The arithmetic average of all values in the data set. In a right-skewed distribution, the mean is pulled in the direction of the skew (to the right).
Median: The middle value when the data are ordered. It is less affected by extreme values than the mean.
Mode: The value that occurs most frequently in the data set. It is located at the peak of the distribution.
Step-by-Step Guidance
Observe the shape of the distribution. Since the tail is longer on the right, this is a right-skewed (positively skewed) distribution.
Recall the typical order of mean, median, and mode in a right-skewed distribution:
Identify the peak of the distribution (the highest point). This is where the mode is located.
The median is the value that divides the area under the curve into two equal halves. It is to the right of the mode but to the left of the mean in a right-skewed distribution.
The mean is pulled furthest in the direction of the skew (to the right), so it will be the rightmost of the three measures.
Try solving on your own before revealing the answer!
Final Answer:
A = Mode, B = Median, C = Mean
In a right-skewed distribution, the mode is at the peak, the median is in the middle, and the mean is furthest to the right due to the influence of higher values.
Q28. What is the probability that a randomly selected student with a Bachelor's degree majored in Physics or Philosophy?
Background
Topic: Probability Using Frequency Tables
This question asks you to calculate the probability of a student majoring in either Physics or Philosophy, given the frequency of each major.
Key Terms and Formulas:
Probability: The likelihood of an event occurring, calculated as
Addition Rule for Disjoint Events: If two events cannot both occur,
Step-by-Step Guidance
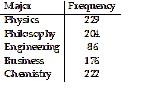
Identify the frequencies for Physics and Philosophy from the table: Physics = 229, Philosophy = 204.
Add the frequencies for Physics and Philosophy to get the total number of students in these two majors.
Find the total number of students by summing all the frequencies in the table.
Set up the probability formula:
Try solving on your own before revealing the answer!
Final Answer: 0.472
The probability is calculated by adding the frequencies for Physics and Philosophy and dividing by the total number of students: (rounded to three decimal places).
Q29. What is the probability that a respondent did not have a low level of satisfaction with the company?
Background
Topic: Probability Using Contingency Tables and the Complement Rule
This question asks you to find the probability that a randomly selected respondent did not have a low satisfaction level, using a contingency table of satisfaction levels and frequency of use.
Key Terms and Formulas:
Complement Rule:
Probability:
Step-by-Step Guidance
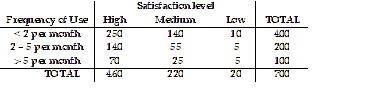
Find the total number of respondents (sum of all entries in the table, or use the provided total).
Find the number of respondents with a low satisfaction level (sum the 'Low' column).
Calculate the probability of a respondent having a low satisfaction level:
Apply the complement rule to find the probability of not having a low satisfaction level:
Try solving on your own before revealing the answer!
Final Answer: 0.97
The probability is . This means 97% of respondents did not have a low satisfaction level.
