Back
BackStep-by-Step Guidance for Binomial Distributions, Sampling, and Confidence Intervals
Study Guide - Smart Notes
 Tailored notes based on your materials, expanded with key definitions, examples, and context.
Q1. What is the probability that 3 or fewer travelers make their own travel arrangements in a sample of 12?
Background
Topic: Binomial Distribution
This question tests your understanding of the binomial probability formula, which is used to calculate the probability of a certain number of successes in a fixed number of independent trials.
Key Terms and Formulas
Binomial Probability Formula:
= number of trials (sample size)
= number of successes
= probability of success on a single trial
Step-by-Step Guidance
Identify the values: , , and you want .
Calculate the probability for each value from to using the binomial formula.
Add the probabilities for , , , and to get .
Check that your calculations use the correct values for , , and in each term.
Try solving on your own before revealing the answer!
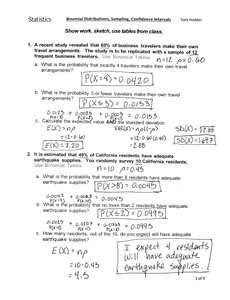
Q2. It is estimated that 45% of California residents have adequate earthquake supplies. What is the probability that in a random sample of 10 residents, exactly 4 have adequate supplies?
Background
Topic: Binomial Distribution
This question is about finding the probability of exactly 4 successes (residents with supplies) in 10 trials, given a probability of success of 0.45.
Key Terms and Formulas
Binomial Probability Formula:
Step-by-Step Guidance
Plug , , and into the binomial formula.
Calculate , which is the number of ways to choose 4 residents out of 10.
Compute and for .
Multiply all terms together to get .
Try solving on your own before revealing the answer!
Q3. Twenty-eight percent of a business’s new clients will not return after one year. You randomly interview 3 clients. What is the probability that 2 clients will not return?
Background
Topic: Binomial Distribution
This question asks you to find the probability that exactly 2 out of 3 clients will not return, given a probability of 0.28.
Key Terms and Formulas
Binomial Probability Formula:
Step-by-Step Guidance
Plug , , and into the binomial formula.
Calculate , which is the number of ways to choose 2 clients out of 3.
Compute and for .
Multiply all terms together to get .
Try solving on your own before revealing the answer!
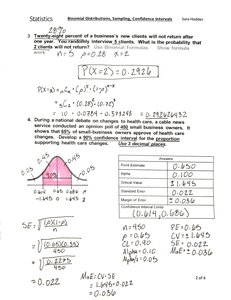
Q4. During a national debate on cable access, a random sample of 450 households is taken. The proportion of households with cable is 0.60. What is the probability that the sample proportion is between 0.56 and 0.64?
Background
Topic: Sampling Distribution of Proportions
This question tests your ability to use the normal approximation to the binomial to find the probability that the sample proportion falls within a certain range.
Key Terms and Formulas
Mean of sampling distribution:
Standard error:
Z-score formula:
Step-by-Step Guidance
Calculate the mean .
Compute the standard error .
Find the z-scores for and using .
Use the z-scores to find the probability that the sample proportion is between 0.56 and 0.64.
Try solving on your own before revealing the answer!
Q5. In a local university, 15% of the students live in dormitories. A random sample of 50 students is selected for a particular study. What is the probability that the sample proportion is between 0.172 and 0.20?
Background
Topic: Sampling Distribution of Proportions
This question tests your ability to use the normal approximation to the binomial for sample proportions.
Key Terms and Formulas
Mean:
Standard error:
Z-score formula:
Step-by-Step Guidance
Calculate the mean .
Compute the standard error .
Find the z-scores for and .
Use the z-scores to find the probability that the sample proportion is between 0.172 and 0.20.
Try solving on your own before revealing the answer!
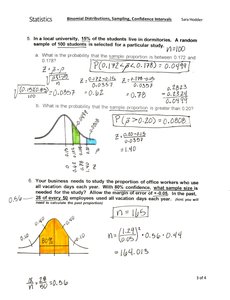
Q6. Your business wants to study the proportion of office workers who use public transportation. You select a random sample of 165 workers and find that 28 of them use public transportation. Allow the use of normal approximation. What is the sample proportion?
Background
Topic: Sample Proportion Calculation
This question is about calculating the sample proportion from the given data and understanding the use of normal approximation for proportions.
Key Terms and Formulas
Sample proportion formula:
= number of successes (workers using public transportation)
= sample size
Step-by-Step Guidance
Identify and .
Calculate the sample proportion .
Interpret the result as the proportion of workers using public transportation.
Try solving on your own before revealing the answer!
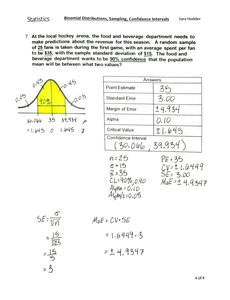
Q7. At the local hockey arena, the food and beverage department needs to make predictions about the revenue for this season. A random sample of 25 fans is taken, with an average spent per fan of $35, and the sample standard deviation is $1.15. The food and fan beverage department wants to be 90% confident that the population mean will be between what two values?
Background
Topic: Confidence Intervals for the Mean
This question tests your ability to construct a confidence interval for the population mean using sample data.
Key Terms and Formulas
Confidence interval formula:
= sample mean
= sample standard deviation
= sample size
= z-value for desired confidence level (for 90%, )
Step-by-Step Guidance
Identify the sample mean , sample standard deviation , and sample size .
Find the z-value for 90% confidence ().
Calculate the margin of error: .
Set up the confidence interval: .
Try solving on your own before revealing the answer!