 Back
BackStep-by-Step Guidance for College Statistics Exam Review
Study Guide - Smart Notes
 Tailored notes based on your materials, expanded with key definitions, examples, and context.
Q1. Find the area of the indicated region under the standard normal curve.
Background
Topic: Standard Normal Distribution (Z-Table)
This question tests your ability to find the probability (area) under the standard normal curve for a given z-score.
Key Terms and Formulas
Standard Normal Distribution: A normal distribution with mean and standard deviation .
Z-score: The number of standard deviations a value is from the mean.
Area under the curve: Represents probability.
Step-by-Step Guidance
Identify the z-score for the region you are interested in (e.g., ).
Use the standard normal (z) table to find the area to the left of .
If the question asks for the area to the right, subtract the table value from 1.
Try solving on your own before revealing the answer!
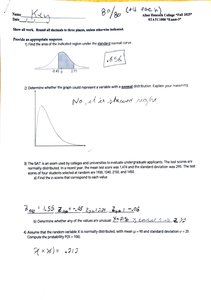
Q2. Determine whether the graph could represent a variable with a normal distribution. Explain your reasoning.
Background
Topic: Properties of Normal Distribution
This question tests your understanding of what a normal distribution looks like and how to recognize it from a graph.
Key Terms and Concepts
Normal Distribution: Symmetrical, bell-shaped curve centered at the mean.
Skewness: If the graph is not symmetrical, it is not normal.
Step-by-Step Guidance
Examine the graph for symmetry about the center.
Check if the tails on both sides are approximately equal.
If the graph is skewed (longer tail on one side), it is not normal.
Try solving on your own before revealing the answer!
Q3. The SAT is an exam used by colleges and universities to evaluate undergraduate applicants. The test scores are normally distributed. In a recent year, the mean test score was 1,474 and the standard deviation was 295. The test scores of four students selected at random are 1930, 1340, 2150, and 1450.
Background
Topic: Z-scores and Normal Distribution
This question tests your ability to calculate z-scores and interpret their meaning in the context of normal distributions.
Key Terms and Formulas
Z-score formula:
Unusual values: Typically, z-scores less than -2 or greater than 2 are considered unusual.
Step-by-Step Guidance
For each score, subtract the mean () from the score ().
Divide the result by the standard deviation () to get the z-score.
Repeat for all four scores.
Compare each z-score to the threshold for unusual values (e.g., ).
Try solving on your own before revealing the answer!
Q4. Assume that the random variable X is normally distributed, with mean and standard deviation . Compute the probability .
Background
Topic: Normal Probability Calculation
This question tests your ability to convert a raw score to a z-score and use the standard normal table to find probabilities.
Key Terms and Formulas
Z-score formula:
Probability: Area under the normal curve to the right of the calculated z-score.
Step-by-Step Guidance
Calculate the z-score for using .
Use the z-table to find the area to the left of this z-score.
Subtract this area from 1 to get .
Try solving on your own before revealing the answer!
Q5. The lengths of pregnancies of humans are normally distributed with a mean of 268 days and a standard deviation of 15 days. Find the probability of a pregnancy lasting less than 250 days.
Background
Topic: Normal Probability Calculation
This question tests your ability to find the probability for a value less than a given x in a normal distribution.
Key Terms and Formulas
Z-score formula:
Probability: Area to the left of the calculated z-score.
Step-by-Step Guidance
Calculate the z-score for using .
Use the z-table to find the area to the left of this z-score.
Try solving on your own before revealing the answer!
Q6. An airline knows from experience that the distribution of the number of suitcases that get lost each week on a certain route is approximately normal with and . What is the probability that during a given week the airline will lose more than 20 suitcases?
Background
Topic: Normal Probability Calculation
This question tests your ability to find the probability for a value greater than a given x in a normal distribution.
Key Terms and Formulas
Z-score formula:
Probability: Area to the right of the calculated z-score.
Step-by-Step Guidance
Calculate the z-score for using .
Use the z-table to find the area to the left of this z-score.
Subtract this area from 1 to get the probability of more than 20 suitcases lost.
Try solving on your own before revealing the answer!
Q7. Assume that the salaries of elementary school teachers in the United States are normally distributed with a mean of $32,000 and a standard deviation of $3,000. If a teacher is selected at random, find the probability that he or she makes less than $28,000.
Background
Topic: Normal Probability Calculation
This question tests your ability to find the probability for a value less than a given x in a normal distribution.
Key Terms and Formulas
Z-score formula:
Probability: Area to the left of the calculated z-score.
Step-by-Step Guidance
Calculate the z-score for using .
Use the z-table to find the area to the left of this z-score.
Try solving on your own before revealing the answer!
Q8. The distribution of cholesterol levels in teenage boys is approximately normal with and . Levels above 200 warrant attention. What percent of teenage boys have levels between 170 and 225?
Background
Topic: Normal Probability Calculation (Between Two Values)
This question tests your ability to find the probability between two values in a normal distribution.
Key Terms and Formulas
Z-score formula:
Probability between two values: Area between two z-scores.
Step-by-Step Guidance
Calculate the z-score for and .
Use the z-table to find the area to the left of each z-score.
Subtract the smaller area from the larger area to get the probability between the two values.
Try solving on your own before revealing the answer!
Q9. An airline knows from experience that the distribution of the number of suitcases that get lost each week on a certain route is approximately normal with and . In one year, how many weeks would you expect the airline to lose between 10 and 20 suitcases?
Background
Topic: Normal Probability and Expected Value
This question tests your ability to find the probability between two values and use it to calculate expected counts over a number of trials.
Key Terms and Formulas
Z-score formula:
Expected value: (weeks in a year)
Step-by-Step Guidance
Calculate the z-scores for and .
Use the z-table to find the area to the left of each z-score.
Subtract the smaller area from the larger area to get the probability between the two values.
Multiply this probability by 52 to estimate the number of weeks.
Try solving on your own before revealing the answer!
Q10. The scores on a mathematics exam have a mean of 78 and a standard deviation of 8. Find the x-value that corresponds to the z-score -1.28.
Background
Topic: Z-score to Raw Score Conversion
This question tests your ability to convert a z-score back to the original value (x) in a normal distribution.
Key Terms and Formulas
Raw score formula:
Step-by-Step Guidance
Multiply the z-score by the standard deviation: .
Add the mean to this result: .
Try solving on your own before revealing the answer!
Q11. Assume that the heights of women are normally distributed with a mean of 63.6 inches and a standard deviation of 2.5 inches. If 100 women are randomly selected, find the probability that they have an average height greater than 63.0 inches.
Background
Topic: Sampling Distribution of the Mean
This question tests your ability to use the Central Limit Theorem to find probabilities about sample means.
Key Terms and Formulas
Standard error:
Z-score for sample mean:
Step-by-Step Guidance
Calculate the standard error: .
Calculate the z-score for using .
Use the z-table to find the area to the right of this z-score.
Try solving on your own before revealing the answer!
Q12. Find the margin of error for the given values of c, , and n. , ,
Background
Topic: Margin of Error for Confidence Intervals
This question tests your ability to calculate the margin of error for a population mean with known standard deviation.
Key Terms and Formulas
Margin of error:
: Critical value for the given confidence level (e.g., )
Step-by-Step Guidance
Find the critical value for 95% confidence (commonly 1.96).
Calculate the standard error: .
Multiply by the standard error to get the margin of error.
Try solving on your own before revealing the answer!
Q13. A random sample of 40 students has a mean annual earnings of \muc = 0.95$. Round to the nearest whole number.
Background
Topic: Confidence Interval for the Mean (Known )
This question tests your ability to construct a confidence interval for the population mean when the population standard deviation is known.
Key Terms and Formulas
Confidence interval:
: Critical value for the given confidence level
Step-by-Step Guidance
Find the critical value for 95% confidence.
Calculate the standard error: .
Multiply by the standard error to get the margin of error.
Add and subtract the margin of error from the sample mean to get the interval endpoints.
Try solving on your own before revealing the answer!
Q14. In a sample of 10 randomly selected women, it was found that their mean height was 63.4 inches. From previous studies, it is assumed that the population standard deviation is 2.4 and that the population of height measurements is normally distributed. Construct the 95% confidence interval for the population mean.
Background
Topic: Confidence Interval for the Mean (Small Sample, Known )
This question tests your ability to construct a confidence interval for the mean with a small sample size and known population standard deviation.
Key Terms and Formulas
Confidence interval:
: Critical value for 95% confidence
Step-by-Step Guidance
Find the critical value for 95% confidence.
Calculate the standard error: .
Multiply by the standard error to get the margin of error.
Add and subtract the margin of error from the sample mean to get the interval endpoints.
Try solving on your own before revealing the answer!
Q15. Using the variable "age" from the provided data set, create a 90% confidence interval. Round to one place to the right.
Background
Topic: Confidence Interval for the Mean (Unknown )
This question tests your ability to construct a confidence interval for the mean when the population standard deviation is unknown, using sample data.
Key Terms and Formulas
Confidence interval:
: Critical value from the t-distribution for 90% confidence and degrees of freedom
Step-by-Step Guidance
Calculate the sample mean () and sample standard deviation () for the "age" variable.
Find the critical value for 90% confidence and the appropriate degrees of freedom.
Calculate the standard error: .
Multiply by the standard error to get the margin of error.
Add and subtract the margin of error from the sample mean to get the interval endpoints.
Try solving on your own before revealing the answer!
Q16. The standard IQ test has a mean of 103 and a standard deviation of 15. We want to be 98% certain that we are within 4 IQ points of the true mean. Determine the required sample size.
Background
Topic: Sample Size for Estimating a Mean
This question tests your ability to determine the sample size needed for a given margin of error and confidence level.
Key Terms and Formulas
Sample size formula:
: Critical value for 98% confidence
: Desired margin of error (4 IQ points)
Step-by-Step Guidance
Find the critical value for 98% confidence.
Plug and into the formula.
Calculate using the formula above.
Try solving on your own before revealing the answer!
Q17. In a random sample of 28 families, the average weekly food expense was $95.60 with a standard deviation of $22.50. Determine whether a normal distribution or a t-distribution should be used or whether neither of these can be used to construct a confidence interval. Assume the distribution of weekly food expenses is normally shaped.
Background
Topic: Choosing the Correct Distribution for Confidence Intervals
This question tests your understanding of when to use the normal (z) or t-distribution for constructing confidence intervals.
Key Terms and Concepts
t-distribution: Used when the population standard deviation is unknown and the sample size is small ().
Normal distribution: Used when the population standard deviation is known or the sample size is large ().
Step-by-Step Guidance
Check if the population standard deviation is known or unknown.
Check the sample size ().
Decide which distribution is appropriate based on these criteria.
Try solving on your own before revealing the answer!
Q18. A survey of 100 fatal accidents showed that 23 were alcohol related. Find a point estimate for , the population proportion of accidents that were alcohol related.
Background
Topic: Point Estimate for a Proportion
This question tests your ability to calculate the sample proportion as a point estimate for the population proportion.
Key Terms and Formulas
Sample proportion:
: Number of successes (alcohol related accidents)
: Total number of trials (accidents)
Step-by-Step Guidance
Divide the number of alcohol related accidents by the total number of accidents: .
Try solving on your own before revealing the answer!
Q19. When 415 college students were surveyed, 195 said they own their car. Construct a 95% confidence interval for the proportion of college students who say they own their cars.
Background
Topic: Confidence Interval for a Proportion
This question tests your ability to construct a confidence interval for a population proportion.
Key Terms and Formulas
Sample proportion:
Standard error:
Confidence interval:
Step-by-Step Guidance
Calculate the sample proportion: .
Calculate the standard error using the formula above.
Find the critical value for 95% confidence.
Multiply by the standard error to get the margin of error.
Add and subtract the margin of error from to get the interval endpoints.
Try solving on your own before revealing the answer!
Q20. A pollster wishes to estimate the proportion of United States voters who favor capital punishment. How large a sample is needed in order to be 90% confident that the sample proportion will not differ from the true proportion by more than 6%?
Background
Topic: Sample Size for Estimating a Proportion
This question tests your ability to determine the required sample size for a given margin of error and confidence level when estimating a proportion.
Key Terms and Formulas
Sample size formula:
If is unknown, use for maximum sample size.
: Desired margin of error (0.06)
: Critical value for 90% confidence
Step-by-Step Guidance
Find the critical value for 90% confidence.
Plug and into the formula.
Calculate using the formula above.
Try solving on your own before revealing the answer!
