 Back
BackStep-by-Step Guidance for Comparing Means in Statistics
Study Guide - Smart Notes
 Tailored notes based on your materials, expanded with key definitions, examples, and context.
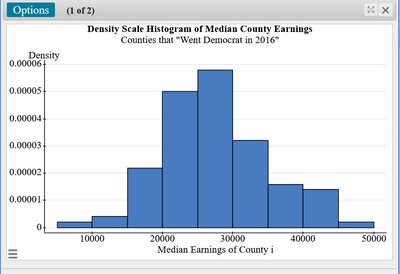
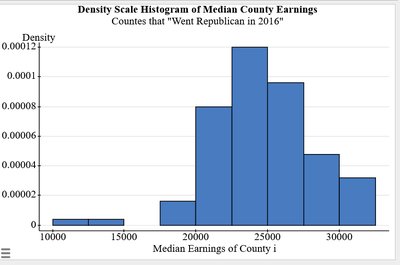
Q1. Do these data suggest that counties that “went Republican” have smaller median-earnings compared to counties that “went Democrat”, in the 2016 U.S. Presidential Election?
Background
Topic: Comparing Two Means (Independent Samples)
This question tests your ability to compare the means of two independent groups (Republican vs. Democrat counties) using statistical hypothesis testing. The goal is to determine if there is evidence that one group has smaller median earnings than the other.
Key Terms and Formulas:
Null Hypothesis ():
Alternative Hypothesis ():
Test Statistic for Two Independent Means:
= sample mean for Republican counties
= sample mean for Democrat counties
, = sample standard deviations
, = sample sizes
Step-by-Step Guidance
State the null and alternative hypotheses clearly. The null hypothesis () assumes no difference or that Republican counties have equal or higher median earnings. The alternative () suggests Republican counties have lower median earnings.
Identify the sample means, standard deviations, and sample sizes for both groups. These values are typically provided in summary statistics or can be calculated from the data.
Set up the formula for the test statistic. Substitute the sample means, standard deviations, and sample sizes into the formula:
Calculate the numerator () and the denominator (the standard error) separately. This helps you organize your computation and check for errors.
Once you have the test statistic, you will use it to find the P-value, which tells you the probability of observing such a difference (or more extreme) if the null hypothesis is true.
Try solving on your own before revealing the answer!
Final Answer:
The test statistic and P-value can be calculated using the formula above. If the P-value is less than your significance level (e.g., 0.05), you would reject the null hypothesis and conclude that Republican counties have significantly lower median earnings.
For the confidence interval, use:
This interval estimates the difference in means with 95% confidence.
Q2. State the statistical hypothesis that seeding cumulus clouds with silver iodide results in increased rainfall.
Background
Topic: Hypothesis Testing for Two Means (Cloud Seeding Experiment)
This question tests your ability to formulate hypotheses for comparing the mean rainfall between seeded and unseeded clouds.
Key Terms and Formulas:
Null Hypothesis ():
Alternative Hypothesis ():
Test Statistic:
= mean rainfall for seeded clouds
= mean rainfall for unseeded clouds
, = sample standard deviations
, = sample sizes
Step-by-Step Guidance
Write out the null and alternative hypotheses. The null hypothesis () assumes seeding does not increase rainfall, while the alternative () suggests it does.
Identify the sample means, standard deviations, and sample sizes for both groups (seeded and unseeded clouds).
Set up the formula for the test statistic using the provided summary statistics.
Calculate the numerator () and the denominator (standard error) separately.
Use the test statistic to find the P-value, which will help you determine whether to reject the null hypothesis.
Try solving on your own before revealing the answer!
Final Answer:
After calculating the test statistic and P-value, you can interpret whether the data support the claim that seeding increases rainfall. The confidence interval for provides an estimate of the difference in mean rainfall.
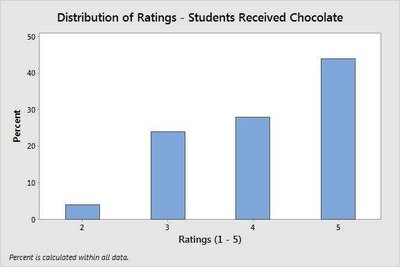
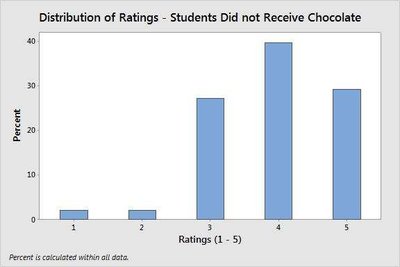
Q3. State the statistical hypotheses to test the theory that giving students chocolate will increase a professor’s/instructor’s ‘teacher rating’.
Background
Topic: Hypothesis Testing for Two Means (Effect of Chocolate on Ratings)
This question tests your ability to set up hypotheses and compare means between two groups: students who received chocolate and those who did not.
Key Terms and Formulas:
Null Hypothesis ():
Alternative Hypothesis ():
Test Statistic:
= mean rating for students who received chocolate
= mean rating for students who did not receive chocolate
, = sample standard deviations
, = sample sizes
Step-by-Step Guidance
State the null and alternative hypotheses. The null hypothesis () assumes chocolate does not increase ratings, while the alternative () suggests it does.
Identify the sample means, standard deviations, and sample sizes for both groups (chocolate and no chocolate).
Set up the formula for the test statistic using the summary statistics.
Calculate the numerator () and denominator (standard error) separately.
Use the test statistic to find the P-value, which will help you decide whether to reject the null hypothesis.
Try solving on your own before revealing the answer!
Final Answer:
After calculating the test statistic and P-value, you can interpret whether giving chocolate significantly increases teacher ratings. The confidence interval for estimates the effect size.
