 Back
BackStep-by-Step Guidance for Hypothesis Testing in Biostatistics
Study Guide - Smart Notes
 Tailored notes based on your materials, expanded with key definitions, examples, and context.
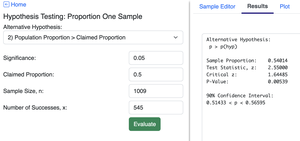
Q1. Is the majority of consumers uncomfortable with drone deliveries? (Given: 1009 surveyed, 545 said "no")
Background
Topic: Hypothesis Testing for a Population Proportion
This question tests your ability to set up and conduct a hypothesis test for a population proportion, using sample data to determine if there is significant evidence to support a claim about the population.
Key Terms and Formulas
Null Hypothesis (H0): The statement that the population proportion equals a specific value.
Alternative Hypothesis (H1): The statement that the population proportion differs from the value in H0 (here, greater than 0.5).
Test Statistic (z):
Where:
= sample proportion
= hypothesized population proportion
= sample size
P-value: The probability of obtaining a test statistic as extreme as the observed one, assuming H0 is true.
Step-by-Step Guidance
Express the claim in symbolic form. Here, the claim is that the majority are uncomfortable: .
State the null and alternative hypotheses:
Null hypothesis:
Alternative hypothesis:
Check requirements for using the normal approximation:
Sample is random
Both and (with , , )
Calculate the sample proportion:
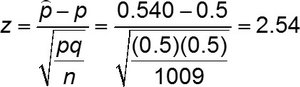
Calculate the test statistic using the formula:
Try solving on your own before revealing the answer!
Final Answer: The test statistic is approximately 2.54, and the P-value is about 0.0054.
Since the P-value is less than the common significance level (e.g., 0.05), there is sufficient evidence to support the claim that the majority of consumers are uncomfortable with drone deliveries.
Q2. Find the value of the test statistic for the claim: Most adults do not have hypertension. (n = 988, 71.1% do not have hypertension)
Background
Topic: Hypothesis Testing for a Population Proportion
This question asks you to calculate the test statistic for a claim about a population proportion, using sample data.
Key Terms and Formulas
Test Statistic (z):
Where:
= sample proportion
= hypothesized population proportion
= sample size
Step-by-Step Guidance
Express the claim in symbolic form. "Most" means .
Calculate the sample proportion: (since 71.1% of 988 adults do not have hypertension).
Set the null hypothesis: and alternative hypothesis: .
Calculate .
Plug the values into the test statistic formula:
Try solving on your own before revealing the answer!
Final Answer: The value of the test statistic is approximately 13.20.
This large z-value indicates the sample proportion is much higher than the hypothesized value under the null hypothesis.
Q3. Find the value of the test statistic for the claim: The mean pulse rate of adult males is equal to 70 bpm. (n = 151, sample mean = 67.7 bpm, s = 11.1 bpm)
Background
Topic: Hypothesis Testing for a Population Mean (σ unknown)
This question tests your ability to calculate the test statistic for a sample mean when the population standard deviation is not known.
Key Terms and Formulas
Test Statistic (t):
Where:
= sample mean
= hypothesized population mean
= sample standard deviation
= sample size
Step-by-Step Guidance
Express the claim in symbolic form: bpm.
Calculate the sample mean bpm and sample standard deviation bpm.
Set the null hypothesis: and alternative hypothesis: .
Plug the values into the test statistic formula:
Try solving on your own before revealing the answer!
Final Answer: The value of the test statistic is approximately -1.44.
This t-value tells you how many standard errors the sample mean is from the hypothesized mean.
