 Back
BackStep-by-Step Guidance for Normal Distribution and Z-Score Problems
Study Guide - Smart Notes
 Tailored notes based on your materials, expanded with key definitions, examples, and context.
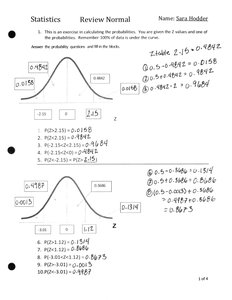
Q1. Calculate probabilities for given Z values using the normal distribution.
Background
Topic: Normal Distribution & Z-Scores
This question tests your ability to use the standard normal distribution and Z-tables to find probabilities associated with specific Z values.
Key Terms and Formulas:
Normal Distribution: A symmetric, bell-shaped distribution characterized by its mean and standard deviation.
Z-Score: Measures how many standard deviations a value is from the mean.
Standard Normal Table (Z-table): Used to find probabilities for Z-scores.
Key formula:
Where:
= value
= mean
= standard deviation
Step-by-Step Guidance
Identify the Z values given in the question.
Use the Z-table to find the probability associated with each Z value. The table gives the area under the curve to the left of the Z value.
If you need the probability between two Z values, subtract the smaller area from the larger area.
For probabilities to the right of a Z value, subtract the table value from 1.
Try solving on your own before revealing the answer!
Final Answer:
Probabilities for each Z value are calculated using the Z-table. For example, , and .
These calculations use the areas under the normal curve as shown in the diagram.
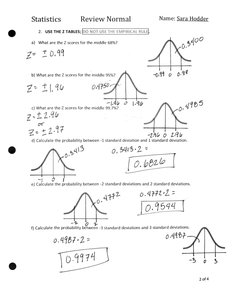
Q2. Find Z-scores for the middle 68% and 95% of the normal distribution.
Background
Topic: Empirical Rule & Z-Scores
This question tests your understanding of the empirical rule, which states that approximately 68% of data falls within 1 standard deviation, and 95% within 2 standard deviations of the mean in a normal distribution.
Key Terms and Formulas:
Empirical Rule: 68-95-99.7% rule for normal distributions.
Z-Score: Standardized value indicating distance from the mean.
Key formula:
Step-by-Step Guidance
Recall the empirical rule: 68% of values are within 1 standard deviation (), 95% within 2 ().
For the middle 68%, find the Z-scores that correspond to the lower and upper bounds (typically and ).
For the middle 95%, find the Z-scores for the lower and upper bounds (typically and ).
Check the Z-table to confirm the exact values if needed.
Try solving on your own before revealing the answer!
Final Answer:
The Z-scores for the middle 68% are approximately and , and for the middle 95% are and .
These values correspond to the empirical rule for normal distributions.
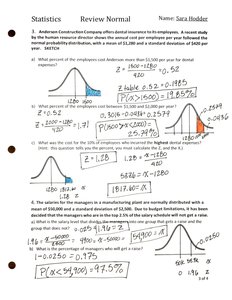
Q3. Apply normal distribution to real-world insurance and salary problems.
Background
Topic: Applications of Normal Distribution
This question tests your ability to apply the normal distribution to real-world scenarios, such as insurance payouts and salary distributions, using Z-scores and probabilities.
Key Terms and Formulas:
Normal Distribution: Used to model real-world data.
Z-Score: Standardized value for comparing data points.
Probability: Area under the curve for a given Z value.
Key formula:
Step-by-Step Guidance
Identify the mean () and standard deviation () from the problem statement.
Calculate the Z-score for the value of interest using .
Use the Z-table to find the probability associated with the calculated Z-score.
Interpret the probability in the context of the real-world scenario (e.g., percent of employees below a certain payout).
Try solving on your own before revealing the answer!
Final Answer:
After calculating the Z-score and using the Z-table, you can determine the percentage of employees or managers meeting the criteria described in the problem.
These steps allow you to apply statistical reasoning to real-world data.
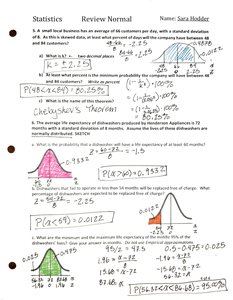
Q4. Use Chebyshev's Theorem and normal distribution to analyze business data.
Background
Topic: Chebyshev's Theorem & Normal Distribution
This question tests your understanding of Chebyshev's Theorem (for any distribution) and the normal distribution (for bell-shaped data) to estimate probabilities and percentages.
Key Terms and Formulas:
Chebyshev's Theorem: Applies to all distributions, not just normal.
Normal Distribution: Used for bell-shaped data.
Z-Score: Standardized value for comparing data points.
Key formula:
Chebyshev's Theorem:
Normal Distribution:
Step-by-Step Guidance
For Chebyshev's Theorem, identify (number of standard deviations from the mean).
Apply the formula to estimate the minimum proportion within standard deviations.
For normal distribution, calculate Z-scores for the values of interest.
Use the Z-table to find probabilities for those Z-scores.
Try solving on your own before revealing the answer!
Final Answer:
Chebyshev's Theorem gives a minimum proportion for any distribution, while the normal distribution allows for more precise probability estimates using Z-scores and the Z-table.
Apply these concepts to answer questions about business data and customer counts.
