 Back
BackStep-by-Step Guidance for Paired Observations and Regression in Statistics
Study Guide - Smart Notes
 Tailored notes based on your materials, expanded with key definitions, examples, and context.
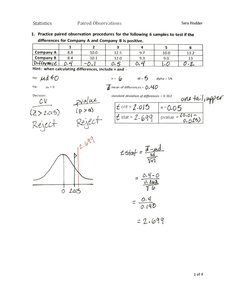
Q1. Practice paired observation procedures for the following 6 samples to test if the difference for Company A and Company B is positive.
Background
Topic: Paired t-test for mean difference
This question tests your ability to conduct a paired t-test to determine if the mean difference between two related samples (Company A and Company B) is significantly greater than zero.
Key Terms and Formulas
Paired t-test: Used when comparing two related groups.
Mean difference (): Average of the differences between paired observations.
Standard deviation of differences (): Measures variability of the differences.
Test statistic:
Critical value (CV): Value from t-distribution table for given significance level ().
Step-by-Step Guidance
Calculate the difference for each pair: for all 6 samples.
Find the mean difference: , where is the number of pairs.
Compute the standard deviation of the differences: .
Set up the null hypothesis: (no difference).
Calculate the t-statistic: .
Try solving on your own before revealing the answer!
Final Answer: t = 2.649, Reject H0
The calculated t-statistic exceeds the critical value, so we reject the null hypothesis and conclude the difference is positive.
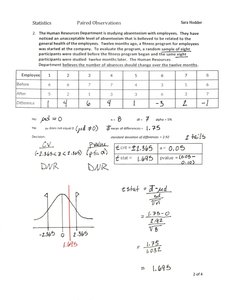
Q2. The human resources department is studying absenteeism with employees. They have gathered data and want to test if absenteeism is different between two departments using paired observations.
Background
Topic: Paired t-test for mean difference
This question tests your ability to use paired t-tests to compare absenteeism between two departments using matched pairs of employees.
Key Terms and Formulas
Paired t-test: Used for comparing two related groups.
Mean difference (), standard deviation (), t-statistic (), and critical value (CV).
Test statistic:
Step-by-Step Guidance
Calculate the difference for each employee: .
Compute the mean difference: .
Find the standard deviation of differences: .
State the null hypothesis: .
Calculate the t-statistic: .
Try solving on your own before revealing the answer!
Final Answer: t = 1.695, Do not reject H0
The calculated t-statistic does not exceed the critical value, so we do not reject the null hypothesis.
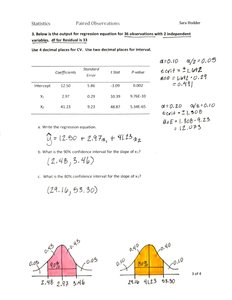
Q3. Below is the output for regression equation for 10 observations with 2 independent variables. Use 4 decimal places for CV. Use two decimal places for interval.
Background
Topic: Linear Regression and Confidence Intervals
This question tests your ability to interpret regression output, write the regression equation, and calculate confidence intervals for regression coefficients.
Key Terms and Formulas
Regression equation:
Confidence interval for slope:
Standard error (SE): Provided in regression output.
Critical value (CV): From t-distribution for given degrees of freedom.
Step-by-Step Guidance
Write the regression equation using the coefficients from the table.
Identify the standard error for the slope and the critical value for the confidence interval.
Set up the confidence interval formula: .
Plug in the values for the slope, critical value, and standard error.
Try solving on your own before revealing the answer!
Final Answer: Regression equation and confidence interval
Regression equation:
90% confidence interval for slope of : (2.19, 53.30)
We used the regression output and the confidence interval formula to find the interval for the slope.
