 Back
BackStep-by-Step Guidance for Statistics Multiple-Choice and Short-Answer Questions
Study Guide - Smart Notes
 Tailored notes based on your materials, expanded with key definitions, examples, and context.
Q5. Based on the information given and the 1.5 × IQR rule, which of the following conclusions can be made about the median and the number of outliers?
Background
Topic: Descriptive Statistics & Outlier Detection
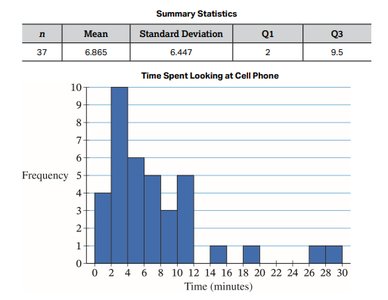
This question tests your understanding of summary statistics (mean, quartiles, standard deviation) and the use of the 1.5 × IQR rule to identify outliers in a data set. It also asks you to interpret the median in relation to the mean, using both the summary table and histogram.
Key Terms and Formulas:
Median: The middle value of the data set when ordered.
Interquartile Range (IQR):
1.5 × IQR Rule for Outliers: Values are considered outliers if they are below or above
Step-by-Step Guidance
Identify the quartiles from the summary statistics: , .
Calculate the interquartile range (IQR): .
Apply the 1.5 × IQR rule to determine the lower and upper bounds for outliers:
Examine the histogram and summary statistics to estimate the median's position relative to the mean (6.865). Consider the shape of the distribution (skewed right or left) and how the median compares to the mean.
Try solving on your own before revealing the answer!
Final Answer: The median is less than 6.865, and the distribution has exactly four outliers.
Using the 1.5 × IQR rule, the lower and upper bounds are calculated as follows:
(no values below this)
From the histogram, there are four values above 20.75, so there are four outliers. The median is less than the mean because the distribution is right-skewed.
