 Back
BackStep-by-Step Guidance for Statistics Practice Questions
Study Guide - Smart Notes
 Tailored notes based on your materials, expanded with key definitions, examples, and context.
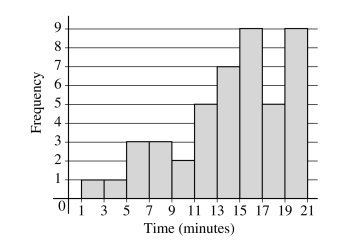
Q9. The histogram above shows the number of minutes needed by 45 students to finish playing a short game. Which of the following statements is correct?
Background
Topic: Describing Distributions
This question tests your ability to interpret the shape of a distribution from a histogram, including concepts such as skewness, modality, and uniformity.
Key Terms:
Skewed Right: Distribution with a longer tail on the right side.
Skewed Left: Distribution with a longer tail on the left side.
Bell-shaped: Distribution that is symmetric and resembles a normal curve.
Uniform: Distribution where all values have similar frequencies.
Step-by-Step Guidance
Examine the histogram and identify where most of the data is concentrated. Notice if the bars are higher on one side.
Look for the direction of the tail: Is there a longer tail on the right or left side of the histogram?
Consider whether the distribution appears symmetric, bell-shaped, or if it has a flat (uniform) appearance.
Compare the histogram to the definitions of skewed right, skewed left, bell-shaped, and uniform distributions.
Try solving on your own before revealing the answer!
Final Answer: (A) The distribution is skewed to the right.
The histogram shows most students finishing in fewer minutes, with a tail extending toward higher times. This is characteristic of a right-skewed distribution.
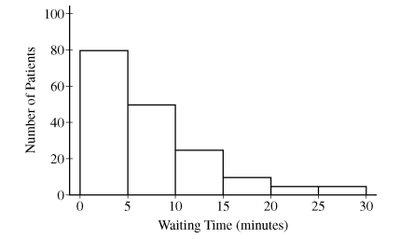
Q10. The histogram below displays the frequencies of waiting times, in minutes, for 175 patients in a dentist's office. Which of the following could be the median of the waiting time, in minutes?
Background
Topic: Measures of Center (Median)
This question tests your ability to estimate the median from a histogram, which is the value that divides the data into two equal halves.
Key Terms:
Median: The middle value when data is ordered from least to greatest.
Histogram: A graphical representation of the distribution of numerical data.
Step-by-Step Guidance
Count the total number of patients (175) and determine the position of the median: th value.
Starting from the left, add up the frequencies in each bar until you reach the 88th patient.
Identify the interval where the cumulative frequency surpasses 88. The median will be within this interval.
Compare the answer choices to the interval you identified.
Try solving on your own before revealing the answer!
Final Answer: (B) 7.25
The median falls within the interval around 7.25 minutes, based on the cumulative frequency from the histogram.
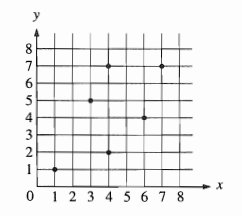
Q11. For which of the following distributions is the mean greater than the median?
Background
Topic: Relationship Between Mean and Median
This question tests your understanding of how the mean and median relate in skewed distributions.
Key Terms:
Mean: The average value of a data set.
Median: The middle value of a data set.
Skewed Right: Mean is greater than median.
Skewed Left: Mean is less than median.
Step-by-Step Guidance
Recall that in a right-skewed distribution, the mean is pulled toward the higher values (right tail).
Examine the provided distributions and identify which one is skewed to the right.
Compare the mean and median for each distribution based on its shape.
Try solving on your own before revealing the answer!
Final Answer: The mean is greater than the median for the right-skewed distribution.
In a right-skewed distribution, the mean is pulled toward the tail, making it greater than the median.
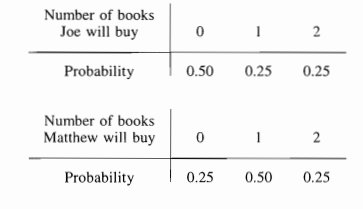
Q28. Joe and Matthew plan to visit a bookstore. Assuming that Joe and Matthew make their decisions independently, what is the probability that they will purchase no books on this visit to the bookstore?
Background
Topic: Probability of Independent Events
This question tests your ability to calculate the probability of two independent events both occurring.
Key Terms and Formula:
Independent Events: Events where the outcome of one does not affect the other.
Probability: The likelihood of an event occurring.
Multiplication Rule for Independent Events:
Step-by-Step Guidance
Identify the probability that Joe buys no books:
Identify the probability that Matthew buys no books:
Since the events are independent, multiply the probabilities:
Try solving on your own before revealing the answer!
Final Answer: 0.1250
The probability that both Joe and Matthew buy no books is .
