 Back
BackStep-by-Step Guidance for Statistics Worksheet: Regression, Probability, and ANOVA
Study Guide - Smart Notes
 Tailored notes based on your materials, expanded with key definitions, examples, and context.
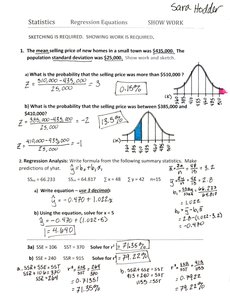
Q1. What is the probability that the selling price was more than $510,000?
Background
Topic: Normal Distribution & Probability
This question tests your understanding of how to use the normal distribution to calculate probabilities for values above a certain threshold, given a mean and standard deviation.
Key Terms and Formulas:
Mean (): The average value, here .
Standard deviation (): The spread of values, here .
Z-score formula:
Normal distribution curve: Used to find probabilities associated with z-scores.
Step-by-Step Guidance
Identify the values: , , .
Calculate the z-score using .
Once you have the z-score, use the standard normal distribution table to find the probability to the right of this z-score (since you want 'more than').
Remember, the table usually gives the probability to the left, so you may need to subtract from 1.
Try solving on your own before revealing the answer!
Final Answer: 0.155%
Probability to the right of is about .
This is a very small probability, indicating that selling prices above are rare in this distribution.
Q2. What is the probability that the selling price was between and ?
Background
Topic: Normal Distribution & Probability (Interval)
This question tests your ability to find the probability that a value falls within a specific range using the normal distribution.
Key Terms and Formulas:
Z-score formula:
Probability between two values:
Step-by-Step Guidance
Calculate the z-score for and using .
Use the normal distribution table to find the probability to the left of each z-score.
Subtract the smaller probability from the larger to get the probability between the two values.
Try solving on your own before revealing the answer!
Final Answer: 13.58%
Probability between these z-scores is about .
Q3. Regression Analysis: Write formula from the following summary statistics and solve for y when x = 5.
Background
Topic: Linear Regression
This question tests your ability to construct a regression equation from summary statistics and use it to predict values.
Key Terms and Formulas:
Regression equation:
Slope ():
Intercept ():
Step-by-Step Guidance
Calculate the slope using the provided summary statistics.
Calculate the intercept using the mean values.
Write the regression equation .
Plug in to the equation, but stop before calculating the final value for .
Try solving on your own before revealing the answer!
Final Answer: y = 14.590
Using the regression equation and plugging in , you get .
This shows how the regression equation can be used for prediction.
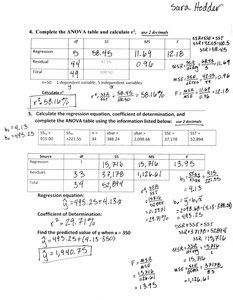
Q4. Complete the ANOVA table and calculate (use 2 decimals).
Background
Topic: ANOVA & Regression
This question tests your ability to fill out an ANOVA table, calculate sums of squares, and determine the coefficient of determination ().
Key Terms and Formulas:
ANOVA table: Shows sources of variation (Regression, Residual, Total), degrees of freedom, sum of squares, mean squares, and F-statistic.
Coefficient of determination:
Mean square:
F-statistic:
Step-by-Step Guidance
Fill in the degrees of freedom for each row (Regression, Residual, Total).
Calculate the sum of squares for regression and residual using the provided data.
Compute the mean squares by dividing sum of squares by degrees of freedom.
Calculate the F-statistic and using the formulas above, but stop before the final calculation.
Try solving on your own before revealing the answer!
Final Answer:
The coefficient of determination is , indicating a very strong fit.
The ANOVA table is completed using the formulas and values provided.
