Back
BackSurveys and Sampling: Foundations of Statistical Inference
Study Guide - Smart Notes
 Tailored notes based on your materials, expanded with key definitions, examples, and context.
Chapter 8: Surveys and Sampling
8.1 Three Ideas of Sampling
Sampling is a fundamental concept in statistics, allowing us to draw conclusions about a population by examining a subset of individuals. This section introduces the three core ideas of sampling: examining a part of the whole, randomization, and the importance of sample size.
Sample—Examine a Part of the Whole: A population is the entire group of individuals we want to study, but it is often impractical to collect data from everyone. Instead, we select a sample, a smaller group intended to represent the population. A sample survey asks questions of a sample to learn about the population. Bias occurs when the sample over- or underemphasizes certain characteristics, leading to inaccurate conclusions.
Randomize: Randomization ensures that every individual has an equal chance of being selected, protecting against unknown influences and making the sample representative. The essential feature of randomness is fairness.
Sample Size Is What Matters: The size of the sample determines the reliability of conclusions, not the fraction of the population sampled. For most practical purposes, the population size is irrelevant unless the sample is a large fraction (over 10%) of the population.
Sampling Error
Even with random sampling, different samples will yield slightly different results. These differences are called sampling error, though no actual error has occurred—this is a natural consequence of random sampling.
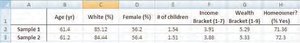
Table: Comparison of Two Random Samples
The table below illustrates how two random samples of 8,000 individuals each can yield very similar summary statistics, demonstrating the effectiveness of random sampling.
Age (yr) | White (%) | Female (%) | # of children | Income Bracket (1-7) | Wealth Bracket (1-6) | Homeowner? (%) | |
|---|---|---|---|---|---|---|---|
Sample 1 | 45.4 | 83.12 | 56.2 | 2.54 | 3.91 | 5.36 | 78.96 |
Sample 2 | 45.2 | 81.44 | 56.4 | 2.51 | 3.88 | 5.38 | 72.3 |
Census
A census is a survey that includes the entire population. However, censuses are often impractical, populations may change, and the process can be cumbersome.
8.2 Populations and Parameters
Statistical models use mathematics to represent reality. The key numbers in these models are called parameters when they describe a population. Any summary calculated from sample data is called a statistic. A sample statistic is used to estimate a population parameter. A sample is representative if its statistics accurately estimate the population parameters.
8.3 Common Sampling Designs
There are several standard methods for selecting samples, each with its own advantages and limitations.
Simple Random Sample (SRS): Every possible sample of the desired size has an equal chance of being selected. Requires a sampling frame—a list of all individuals in the population. Sampling variability (or sampling error) refers to the natural differences between samples.
Stratified Sampling: The population is divided into homogeneous groups (strata), and a random sample is taken from each stratum. This reduces sampling variability.
Cluster Sampling: The population is split into clusters that each represent the population. A random selection of clusters is surveyed, often using a census within each selected cluster. This method is cost-effective and practical.
Multistage Sampling: Combines several sampling methods, such as stratifying and then clustering.
Systematic Sampling: Individuals are selected systematically (e.g., every 10th person), starting from a randomly chosen individual.
Practical Considerations
The population may not be well-defined.
The sampling frame may not match the population of interest.
Nonresponse and changing populations can introduce bias.
Examples of Sampling Designs
At the Bar: Systematic sampling of bar patrons to estimate U.S. adults' opinions on drinking and driving. The sampling frame is bar patrons, which may not represent all U.S. adults.
HR Directors: Nonrandom survey of Fortune 500 HR directors with nonresponse bias, as only 23% responded.
Amusement Park Riders: Systematic sampling of patrons in line for a roller coaster. The sample is not representative of all park patrons, as only those willing to wait are included.
8.4 The Valid Survey
A valid survey accurately measures what it is intended to measure about the population of interest. To ensure validity, consider:
What do I want to know? Be clear about your research question and target population.
Who are the right respondents? Use an appropriate sampling frame and ensure respondents have the necessary information.
What are the right questions? Ask specific, unbiased questions. Avoid nonresponse and voluntary response bias.
What will be done with the results? Plan for how the data will be used.
Careful question and answer phrasing is essential to avoid measurement errors. Pilot testing the survey can help identify and correct issues.
Examples of Biased Questions
"Should companies that pollute the environment be compelled to pay the costs of cleanup?" Biased due to the word "pollute." Suggested change: "Should companies be responsible for the cost of environmental cleanup?"
"Do you think that price or quality is more important in selecting an MP3 player?" Unbiased.
"Should a company enforce a strict dress code?" Biased due to "enforce" and "strict." Suggested change: "Should companies have dress codes?"
8.5 How to Sample Badly
Poor sampling methods can introduce significant bias and invalidate results.
Voluntary Response Sample: Individuals choose to participate, leading to bias as those with strong opinions are more likely to respond.
Convenience Sampling: Selecting individuals who are easiest to reach, which may not represent the population.
Bad Sampling Frame: Using an incomplete or inappropriate list for sampling introduces bias.
Undercoverage: Some groups are not represented or are underrepresented in the sample.
Examples of Bad Sampling
Randomly selecting doctors from Yellow Pages may be appropriate only if all doctors are listed; otherwise, it introduces bias.
Calling every business on a randomly selected Yellow Pages page is not appropriate, as it likely includes only certain types of businesses (cluster sampling issue).
Other Sources of Bias
Nonresponse Bias: When those who do not respond differ from those who do.
Response Bias: Respondents may tailor answers to please the interviewer or due to slanted question wording.
Push Polls: Surveys that present one side of an issue before asking a question, leading to biased responses.
Summary: Key Points
Understand the three ideas of sampling: examine a part of the whole, randomize, and focus on sample size.
Be able to draw a Simple Random Sample (SRS) and understand other sampling methods (stratified, cluster, systematic, multistage).
Identify and avoid sources of bias: nonresponse, response, voluntary response, convenience sampling, and undercoverage.
Always report sampling methods in detail and pretest surveys when possible.