 Back
BackZ-Table Exercises: Critical Values for Confidence Intervals and Hypothesis Testing
Study Guide - Smart Notes
 Tailored notes based on your materials, expanded with key definitions, examples, and context.
Z-Table Exercises and Critical Values
Introduction to Z-Tables
Z-tables are essential tools in statistics for finding critical values associated with the standard normal distribution. These values are used in hypothesis testing and constructing confidence intervals. The table below summarizes the critical Z-values for common confidence levels in both one-tailed and two-tailed tests.
Understanding Confidence Levels and Tails
Confidence Level: The probability that a parameter lies within the specified interval. Common levels are 99%, 95%, 90%, 85%, and 80%.
Two-Tailed Test: Used when deviations in both directions are considered significant. The area in both tails sums to the significance level (α).
One-Tailed Test: Used when only deviations in one direction are considered significant. The area in one tail equals the significance level (α).
Critical Z-Values for Common Confidence Levels
The following table summarizes the critical Z-values for various confidence levels, for both two-tailed and one-tailed tests. These values are used to determine rejection regions in hypothesis testing and to construct confidence intervals.
Confidence Level | Two-Tailed (α/2 in each tail) | One-Tailed (α in one tail) |
|---|---|---|
99% | Z = ±2.58 α = 0.01 | Z = +2.33 or -2.33 α = 0.01 |
95% | Z = ±1.96 α = 0.05 | Z = +1.65 or -1.65 α = 0.05 |
90% | Z = ±1.645 α = 0.10 | Z = +1.28 or -1.28 α = 0.10 |
85% | Z = ±1.44 α = 0.15 | Z = +1.04 or -1.04 α = 0.15 |
80% | Z = ±1.28 α = 0.20 | Z = +0.84 or -0.84 α = 0.20 |
How to Use Critical Z-Values
For a confidence interval, use the Z-value corresponding to your desired confidence level to calculate the margin of error.
For a hypothesis test, compare your test statistic to the critical Z-value to determine whether to reject the null hypothesis.
Formulas
Confidence Interval for Mean (σ known):
Test Statistic (Z):
Example
Suppose you want to construct a 95% confidence interval for a population mean with a known standard deviation. The critical Z-value is ±1.96. If your sample mean is 100, standard deviation is 15, and sample size is 25:
So, the 95% confidence interval is (94.12, 105.88).
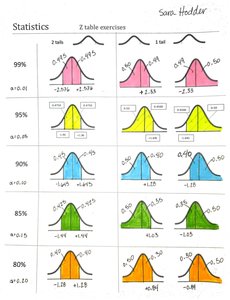
Additional info: The color-coded normal curves in the image visually represent the rejection regions for each confidence level and tail configuration, reinforcing the tabular data above.
