Ch. 12 - Analysis of Variance
Triola - Elementary Statistics 14th Edition
Triola14th EditionElementary StatisticsISBN: 9780137366446Not the one you use?Change textbook
Chapter 12, Problem 12.Q.8

Pulse Rates Shown below are pulse rates from Data Set 1 “Body Data” in Appendix B, and the StatCrunch display from two-way analysis of variance of these data. In analyzing these data, what important feature is addressed with two-way analysis of variance that is not addressed with two separate tests of (1) difference between mean pulse rates based on gender, or (2) differences among the mean pulse rates in the different age brackets?
Table showing pulse rates by age group and gender, with an ANOVA table displaying sources, degrees of freedom, sums of squares, mean squares, F-statistics, and p-values.

Verified step by step guidance
1
Step 1: Understand the purpose of two-way ANOVA. Two-way analysis of variance (ANOVA) is used to examine the effect of two different categorical independent variables (factors) on a continuous dependent variable, and also to check if there is an interaction effect between these two factors.
Step 2: Identify the factors in the problem. Here, the two factors are 'Age' (with three groups: 18-29, 30-49, 50-80) and 'Gender' (with two groups: Female and Male). The dependent variable is the pulse rate.
Step 3: Recognize what separate tests would do. Conducting separate tests for (1) difference between mean pulse rates based on gender and (2) differences among mean pulse rates in different age brackets would only analyze the main effects independently, ignoring any possible interaction between age and gender.
Step 4: Understand the interaction term in two-way ANOVA. The interaction term tests whether the effect of one factor (e.g., gender) on pulse rate depends on the level of the other factor (e.g., age group). This is an important feature that separate one-way ANOVAs or t-tests cannot detect.
Step 5: Conclude the importance of two-way ANOVA. By using two-way ANOVA, you can simultaneously test for the main effects of age and gender and also determine if there is a significant interaction effect between age and gender on pulse rates, providing a more comprehensive analysis.

Verified video answer for a similar problem:

This video solution was recommended by our tutors as helpful for the problem above.
Video duration:
1m
Was this helpful?

Key Concepts

Here are the essential concepts you must grasp in order to answer the question correctly.

Two-Way Analysis of Variance (ANOVA)

Two-way ANOVA is a statistical method used to examine the effect of two independent categorical variables on a continuous dependent variable simultaneously. It allows testing for main effects of each factor and their interaction effect, providing a more comprehensive analysis than separate one-way ANOVAs.
Recommended video:
06:46
Introduction to ANOVA

Interaction Effect

The interaction effect in two-way ANOVA tests whether the effect of one factor depends on the level of the other factor. This is important because it reveals if the combined influence of factors differs from their individual effects, which cannot be detected by separate tests.
Recommended video:
03:33
Finding Binomial Probabilities Using TI-84 Example 1

Main Effects vs. Interaction

Main effects refer to the individual impact of each factor (e.g., age or gender) on the response variable, while interaction effects show how factors jointly influence the response. Two-way ANOVA distinguishes these effects, unlike separate tests that only assess main effects independently.
Recommended video:
Guided course
04:39
Visualizing Qualitative vs. Quantitative Data
Related Practice
Textbook Question

One vs. Two What is the fundamental difference between one-way analysis of variance and two-way analysis of variance?
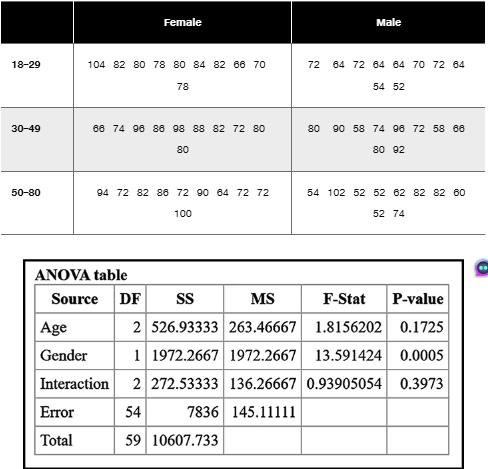
104
views
Textbook Question

Interaction

b. If there does appear to be an interaction between gender and age bracket, how should we continue with the procedure for two-way analysis of variance?

58
views
Textbook Question

Win 4 Lottery Shown below is a histogram of digits selected in California’s Win 4 lottery. Each drawing involves the random selection (with replacement) of four digits between 0 and 9 inclusive.


b. Does the display depict a normal distribution? Why or why not? What should be the shape of the histogram?


141
views
Textbook Question

Gender and Age Bracket Based on the display included with Exercise 8, what are the final conclusions?

36
views
Textbook Question

In Exercises 1–5, refer to the following list of numbers of years that deceased U.S. presidents, popes, and British monarchs lived after their inauguration, election, or coronation, respectively. (As of this writing, the last president is George H. W. Bush, the last pope is John Paul II, and the last British monarch is George VI.) Assume that the data are samples from larger populations.


[Image]


Exploring the Data Include appropriate units in all answers.


e. What is the level of measurement of the data (nominal, ordinal, interval, ratio)?

131
views
Textbook Question

"Interaction

a. Based on the display included with the preceding exercise, what do you conclude about an interaction between gender and age bracket?

45
views