Each function graphed is of the form y = c + cos x, y = c + sin x, y = cos(x - d), or y = sin(x - d), where d is the least possible positive value. Determine an equation of the graph.
<IMAGE>
Verified step by step guidance
1
Identify the key features of the graph such as amplitude, vertical shift, and phase shift. Since the functions are of the form \(y = c + \cos x\), \(y = c + \sin x\), \(y = \cos(x - d)\), or \(y = \sin(x - d)\), determine the vertical shift \(c\) by finding the midline of the graph (the average of the maximum and minimum values).
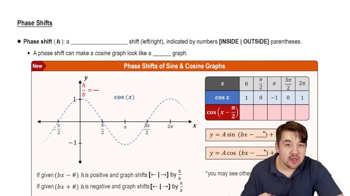
Determine whether the graph resembles a sine or cosine function by looking at the starting point at \(x=0\). If the graph starts at a maximum or minimum, it is likely a cosine function; if it starts at the midline going upward or downward, it is likely a sine function.
Find the period of the function by measuring the distance between two consecutive peaks or troughs. The standard period for sine and cosine is \(2\pi\), so use this to confirm if there is any horizontal stretching or compression.
Calculate the phase shift \(d\) by identifying the horizontal shift from the standard sine or cosine graph. The phase shift is the smallest positive value such that the function matches the graph, and it appears inside the function argument as \(x - d\).
Write the equation by combining the vertical shift \(c\), the function type (sine or cosine), and the phase shift \(d\) into the form \(y = c + \cos(x - d)\) or \(y = c + \sin(x - d)\), using the values you have determined.
Verified video answer for a similar problem:
This video solution was recommended by our tutors as helpful for the problem above
Play a video:
0 Comments
Key Concepts
Here are the essential concepts you must grasp in order to answer the question correctly.
Amplitude and Vertical Shift in Trigonometric Functions
The amplitude of sine and cosine functions determines the height of their peaks and troughs, while the vertical shift (represented by 'c' in y = c + sin x or y = c + cos x) moves the entire graph up or down. Understanding these helps identify the midline and range of the graph.
The phase shift, indicated by 'd' in y = sin(x - d) or y = cos(x - d), represents a horizontal shift of the graph along the x-axis. The least positive value of 'd' moves the graph rightward, changing where the function starts its cycle, which is crucial for matching the graph's position.
Sine and cosine functions differ in their starting points: cosine starts at a maximum when x=0, while sine starts at zero. Recognizing whether the graph resembles a sine or cosine wave helps determine the correct base function before applying shifts and vertical translations.

 Verified step by step guidance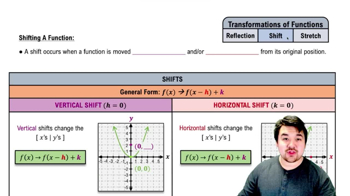
 5:34
5:34