In Exercises 29–44, graph two periods of the given cosecant or secant function. y = sec x/3
Verified step by step guidance
1
Identify the given function: \(y = \sec\left(\frac{x}{3}\right)\). This is a secant function with the argument \(\frac{x}{3}\) inside the secant.
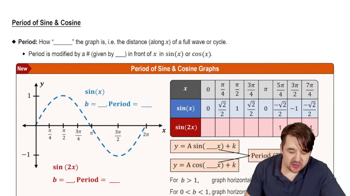
Recall the period of the basic secant function \(y = \sec x\) is \(2\pi\). For \(y = \sec(bx)\), the period is given by \(\frac{2\pi}{b}\). Here, \(b = \frac{1}{3}\), so the period is \(2\pi \times 3 = 6\pi\).
Since the problem asks to graph two periods, calculate the total length on the x-axis to graph: \(2 \times 6\pi = 12\pi\).
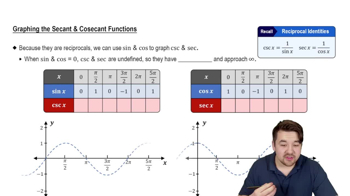
Determine the key points for one period of \(y = \sec\left(\frac{x}{3}\right)\) by considering the related cosine function \(y = \cos\left(\frac{x}{3}\right)\), because \(\sec x = \frac{1}{\cos x}\). Identify where \(\cos\left(\frac{x}{3}\right) = 0\) (vertical asymptotes for secant) and where \(\cos\left(\frac{x}{3}\right)\) reaches its maxima and minima (secant's minimum and maximum values).
Plot the vertical asymptotes at points where \(\cos\left(\frac{x}{3}\right) = 0\), which occur at \(x = 3\left(\frac{\pi}{2} + k\pi\right)\) for integers \(k\). Then sketch the secant curve between these asymptotes over the interval \([0, 12\pi]\) to show two full periods.
Verified video answer for a similar problem:
This video solution was recommended by our tutors as helpful for the problem above
Video duration:
13m
Play a video:
0 Comments
Key Concepts
Here are the essential concepts you must grasp in order to answer the question correctly.
Understanding the Secant Function
The secant function, sec(x), is the reciprocal of the cosine function, defined as sec(x) = 1/cos(x). It is undefined where cosine equals zero, leading to vertical asymptotes in its graph. Recognizing these properties helps in sketching the secant curve accurately.
The period of a function is the length of one complete cycle before it repeats. For sec(x), the period is 2π. When the function is sec(x/3), the period stretches by a factor of 3, becoming 6π. Knowing the period is essential to graph the correct interval, especially when asked to plot multiple periods.
Graphing sec(x/3) involves first plotting the corresponding cosine function, cos(x/3), identifying zeros where secant has vertical asymptotes. Then, plot the secant values as the reciprocal of cosine, noting the shape of the curves between asymptotes. This approach ensures an accurate and clear graph.

 13:38 minutes
 Verified step by step guidance
 6:22
6:22