Determine an equation of the form y = a cos bx or y = a sin bx, where b > 0, for the given graph. See Example 6. <IMAGE>
Verified step by step guidance
1
Identify the key characteristics of the given graph, such as amplitude, period, phase shift, and vertical shift. These will help determine the values of \(a\), \(b\), and whether the function is sine or cosine.
Determine the amplitude \(a\) by finding the distance from the midline of the graph to its maximum or minimum value. This is the absolute value of \(a\) in the equation \(y = a \sin(bx)\) or \(y = a \cos(bx)\).
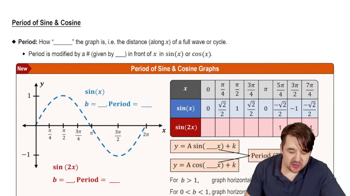
Calculate the period of the function by measuring the length of one complete cycle on the x-axis. Use the formula for period: \(\text{Period} = \frac{2\pi}{b}\). Solve for \(b\) as \(b = \frac{2\pi}{\text{Period}}\).
Decide whether the function is sine or cosine by examining the starting point of the graph at \(x=0\). If the graph starts at a maximum or minimum, it is likely a cosine function; if it starts at the midline going upward or downward, it is likely a sine function.
Write the equation in the form \(y = a \sin(bx)\) or \(y = a \cos(bx)\) using the values of \(a\) and \(b\) found, and include any phase shifts or vertical shifts if present.
Verified video answer for a similar problem:
This video solution was recommended by our tutors as helpful for the problem above
Play a video:
0 Comments
Key Concepts
Here are the essential concepts you must grasp in order to answer the question correctly.
General Form of Sine and Cosine Functions
The equations y = a sin bx and y = a cos bx represent sinusoidal functions where 'a' controls the amplitude (height) and 'b' affects the period (frequency). Understanding these forms helps in modeling periodic behavior seen in graphs.
Amplitude is the maximum value of the function, given by |a|, while the period is the length of one complete cycle, calculated as 2π/b. Identifying these from the graph is essential to determine the parameters 'a' and 'b' in the equation.
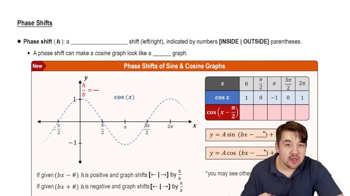
Sine and cosine functions differ by a horizontal shift (phase shift). By analyzing the graph's starting point and shape, one can decide whether to use sine or cosine to best fit the data without additional phase shifts.

 Verified step by step guidance
 5:53
5:53