Join thousands of students who trust us to help them ace their exams!
Multiple Choice
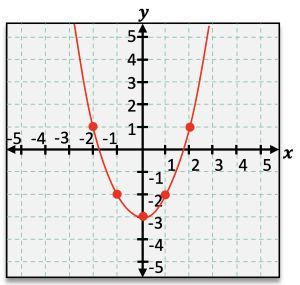
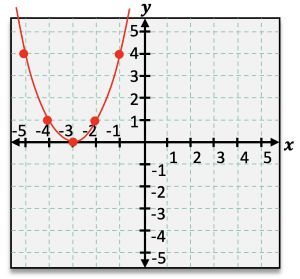
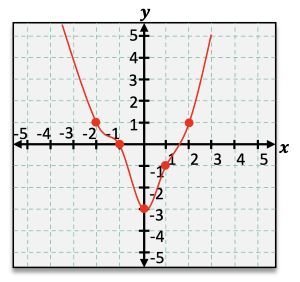
Graph the equation y−x2+3=0 by choosing points that satisfy the equation.
A
B
C
D
0 Comments
Verified step by step guidance
1
Start by rewriting the given equation y - x^2 + 3 = 0 in a more familiar form. Rearrange it to y = x^2 - 3.
Identify the type of graph this equation represents. The equation y = x^2 - 3 is a quadratic equation, which graphs as a parabola.
Determine the vertex of the parabola. Since the equation is in the form y = x^2 - 3, the vertex is at the point (0, -3).
Choose a few x-values to find corresponding y-values that satisfy the equation. For example, if x = 0, y = -3; if x = 1, y = 1^2 - 3 = -2; if x = -1, y = (-1)^2 - 3 = -2.
Plot the points (0, -3), (1, -2), (-1, -2), and additional points like (2, 1) and (-2, 1) on the graph. Connect these points with a smooth curve to complete the parabola.


 Verified step by step guidance
