Here are the essential concepts you must grasp in order to answer the question correctly.
Graphing Polynomial Functions
Graphing polynomial functions involves plotting points based on the function's output for various input values. The shape of the graph is determined by the degree of the polynomial and the leading coefficient. For example, a cubic function like g(x) = ½ x³ - 4 will have an 'S' shape, with one end rising and the other falling, reflecting its odd degree.
Recommended video:
Graph of Sine and Cosine Function
Understanding the Behavior of Cubic Functions
Cubic functions, characterized by the x³ term, exhibit unique behavior such as having one inflection point and potentially two turning points. The leading coefficient influences the direction of the ends of the graph; a positive coefficient results in the left end falling and the right end rising. This behavior is crucial for predicting how the graph will look and where it will intersect the axes.
Recommended video:
Introduction to Relations and Functions
Finding Key Features of the Graph
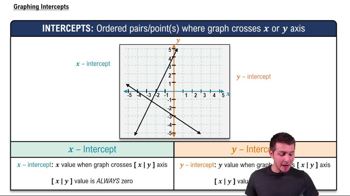
Key features of a graph include intercepts, turning points, and asymptotic behavior. For the function g(x) = ½ x³ - 4, the y-intercept can be found by evaluating g(0), which gives -4. Additionally, analyzing the first derivative helps identify critical points where the function changes direction, providing insight into the graph's overall shape and behavior.
Recommended video: