Back
BackComprehensive Biochemistry and Molecular Biology Study Guide
Study Guide - Smart Notes
 Tailored notes based on your materials, expanded with key definitions, examples, and context.
Core Biochemical Definitions and Interactions
Key Definitions
Understanding fundamental elements is essential in biochemistry. Molecular definitions and interactions provide the basis for understanding the structure and function of life.
Type | Description | Example/Context |
|---|---|---|
Resonance Structures | Alternative arrangements of double and single bonds within a molecule, stabilizing charge distribution. | Acetone molecule |
Hydrogen Bond | Electrostatic attraction between a hydrogen atom (bonded to electronegative atom) and another electronegative atom. Key for protein folding, DNA base pairing, and water properties. | DNA base pairs |
Acids | Proton donors (Brønsted-Lowry definition). | Form conjugate acids after gaining protons |
Overview: Molecular Foundations
Molecular structure shapes function, with the DNA’s templating ability, amino acid sequence segments highlighting the fundamental chemical principles underlying biochemistry. Key foundational concepts include:
Resonance & Bonding
Hydrogen Bonding & Hydrophobic Effect
Properties of Water
Acids, Bases, and pH calculations
Buffer systems
Non-Covalent Interactions
Types and Energy Ranges
Non-covalent interactions play crucial roles in molecular recognition, protein folding, nucleic acids, and enzymes. Their energies are significantly lower than covalent bonds.
Interaction Type | Energy Range (kJ/mol) |
|---|---|
Van der Waals (London/Forces) | 0.4–4 |
Hydrophobic Interactions | 8–40 |
Hydrogen Bond/Forces | 12–30 |
Electrostatic Interactions | 20–40 |
Hydrophobic Interactions and the Hydrophobic Effect
Hydrophobic interactions arise due to hydrophobic effect, where nonpolar molecules aggregate in aqueous solutions, water molecules surrounding them form ordered cages (solvation shells). This effect is essential for protein folding, membrane formation, and molecular assembly.
Hydrophobic Effect: Drives nonpolar molecules to minimize contact with water, increasing entropy.
Example: Protein folding, lipid bilayer formation.
Properties of Water
Key Properties
Water is a universal solvent, key to all biological processes and chemical properties.
Hydrogen Bonding: Enables water’s high boiling point, heat capacity, and solvent properties.
Polarity: Water’s dipole enables solvation of ions, hydrophilic molecules, and exclusion of hydrophobic molecules.
Additional info: Water’s structure allows for dynamic hydrogen bonding networks, critical for biochemical reactions.
Water and pH Calculations
The ionization of water is fundamental to pH. The equilibrium constant (Kw) for water provides the basis for pH calculations.
pH:
pOH:
Kw:
Relationship:
Acid Dissociation Constant and Henderson-Hasselbalch Equation
Acid dissociation constant (Ka) and pKa describe the strength of acids. The Henderson-Hasselbalch equation relates pH, pKa, and the ratio of conjugate base to acid.
Henderson-Hasselbalch Equation:
Buffer: A solution that resists changes in pH, consisting of a weak acid and its conjugate base.
Amino Acids: Building Blocks of Proteins
Chirality and Stereoisomers
Amino acids are chiral molecules, except glycine, and exist as L and D forms, but only L is used in proteins. Chirality is essential for protein structure and function.
Chiral Center: The α-carbon is the site of rotation and stereochemistry.
Classification: Amino acids are classified by side chain properties: polar, nonpolar, acidic, basic.
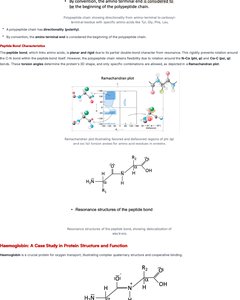
Peptide Bond Characteristics
The peptide bond, which links amino acids, is planar and rigid due to partial double bond character from resonance. This rigidity promotes rotational constraints and influences protein folding.
Resonance: Peptide bond exhibits resonance, stabilizing protein backbone.
Example: Ramachandran plot shows allowed dihedral angles for protein backbone.
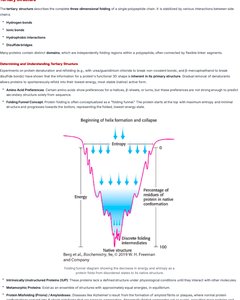
Protein Structure
Primary, Secondary, Tertiary, and Quaternary Structure
Proteins exhibit hierarchical structure:
Primary Structure: Linear sequence of amino acids.
Secondary Structure: Local folding into α-helices and β-sheets stabilized by hydrogen bonds.
Tertiary Structure: Three-dimensional folding of a single polypeptide chain.
Quaternary Structure: Arrangement of multiple polypeptide chains.
Collagen: Structure, Production, and Types
Collagen is a structural protein formed by repeating Gly-X-Y amino acid sequence. It forms triple helix fibers, providing strength and flexibility to tissues.
Collagen Synthesis: Involves hydroxylation, glycosylation, and cross-linking.
Types: Type I (bone, skin), Type II (cartilage), Type III (reticular fibers).
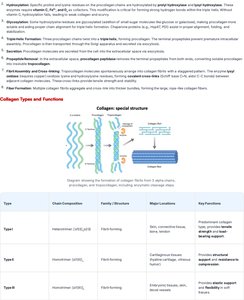
Type | Chain Composition | Family/Structure | Major Locations | Key Functions |
|---|---|---|---|---|
Type I | Heterotrimer (α1/α2) | Fibril-forming | Bone, skin, tendon | Strength, support |
Type II | Homotrimer (α1) | Fibril-forming | Cartilage | Resilience, shock absorption |
Type IV | Heterotrimer (α1/α2/α3) | Network-forming | Basement membranes | Filtration, matrix structure |
Post-Translational Modifications (PTMs)
Types and Roles
PTMs create chemical and structural changes in proteins after translation, primarily in the endoplasmic reticulum (ER) and Golgi apparatus. They diversify protein function and localization.
Functional Group Addition/Removal: Phosphorylation, acetylation, methylation, ubiquitination.
Proteolytic Cleavage: Removal of signal peptides, activation of zymogens.
Glycosylation: Addition of carbohydrate groups, important for cell signaling.
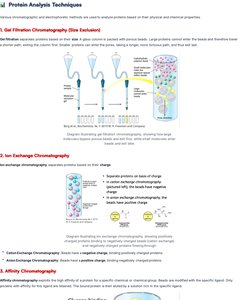
Protein Analysis Techniques
Chromatography
Chromatographic separation and electrophoretic methods are used to analyze proteins based on their physical and chemical properties.
Gel Filtration Chromatography: Separates proteins based on size.
Ion Exchange Chromatography: Separates proteins based on charge.
Affinity Chromatography: Separates proteins based on specific binding interactions.
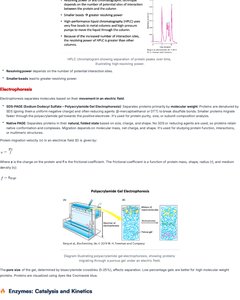
Electrophoresis
Electrophoresis separates molecules based on their movement in an electric field.
SDS-PAGE: Denatures proteins, separates by molecular weight.
Native PAGE: Separates proteins by charge and shape.
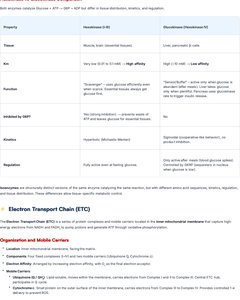
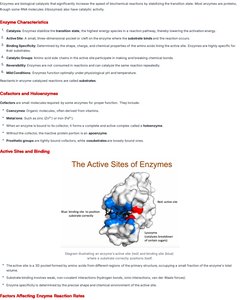
Enzymes: Catalysis and Kinetics
Enzyme Characteristics
Enzymes are biological catalysts that significantly increase the speed of biochemical reactions by stabilizing the transition state.
Active Site: Region where substrate binds and reaction occurs.
Specificity: Enzymes are highly specific for their substrates.
Example: Hexokinase catalyzes phosphorylation of glucose.
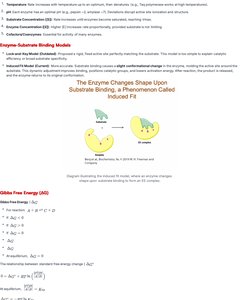
Enzyme-Substrate Binding Models
Lock-and-key and induced-fit models describe how enzymes bind substrates.
Lock-and-Key Model: Substrate fits perfectly into active site.
Induced Fit Model: Enzyme changes shape upon substrate binding.
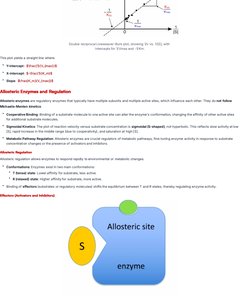
Allosteric Enzymes and Regulation
Allosteric enzymes are regulatory enzymes that typically have multiple subunits and multiple active sites, which influence each other. They do not follow Michaelis-Menten kinetics.
Positive Effectors: Increase enzyme activity.
Negative Effectors: Decrease enzyme activity.
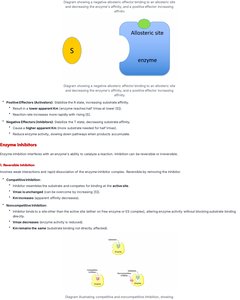
Enzyme Inhibitors
Enzyme inhibitors reduce an enzyme’s ability to catalyze a reaction.
Competitive Inhibition: Inhibitor binds active site, preventing substrate binding.
Noncompetitive Inhibition: Inhibitor binds elsewhere, reducing enzyme activity without blocking substrate binding.
Carbohydrates: Structure and Function
Monosaccharides and Isomers
Carbohydrates are classified by number of carbons, hydrogen, and oxygen, generally following the formula (CH2O)n.
Monosaccharides: Simple sugars, classified by number of carbons (triose, tetrose, pentose, hexose).
Isomers: Constitutional isomers, stereoisomers, enantiomers, epimers.
Polysaccharides (Glycogen)
Polysaccharides are composed of glucose monomers, providing energy storage and structural support.
Feature | Amylose (Starch) | Amylopectin (Starch) | Glycogen | Cellulose | Chitin |
|---|---|---|---|---|---|
Function | Plant energy storage | Plant energy storage | Animal energy storage | Structural (plants) | Structural (fungi/insects) |
Branching | None | Every 24–30 | Every 8–12 | None | None |
Shape | Coiled spiral | Branched | Highly branched | Straight rigid sheets | Straight rigid sheets |
Digestibility | Easy | Easy | Very Easy | Indigestible | Indigestible |
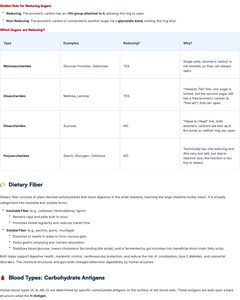
Isomers and Reducing Sugars
Carbohydrates exhibit various forms of isomerism, contributing to their diverse biological roles. Understanding reducing sugars is important for their chemical reactivity.
Reducing Sugars: Contain a free aldehyde or ketone group, allowing them to reduce other molecules.
Non-Reducing Sugars: Contain no free aldehyde or ketone group.
Type | Examples | Reducing? | Why? |
|---|---|---|---|
Monosaccharides | Glucose, Fructose, Galactose | YES | Single open carbonyl, can reduce |
Disaccharides | Maltose, Lactose | YES | "Needs to react" but, one sugar is open |
Disaccharides | Sucrose | NO | "Locked in bond", both sugars are closed |
Polysaccharides | Starch, Glycogen, Cellulose | NO | "Locked in bond", all sugars are closed |
ATP: The Energy Currency
Structure and Function
Adenosine triphosphate (ATP) is the primary energy carrier in cells. It acts as a good energy source due to its high-energy phosphate bonds.
High-Energy Bonds: The terminal phosphate groups are linked by high-energy phosphoanhydride bonds.
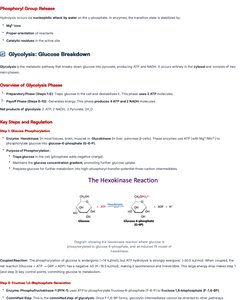
Phosphoryl Transfer Potential: ATP hydrolysis releases energy, driving cellular processes.
Glycolysis: Glucose Breakdown
Overview and Key Steps
Glycolysis is a metabolic pathway that breaks down glucose into pyruvate, producing ATP and NADH. It occurs entirely in the cytosol and consists of ten steps.
Key Steps: Hexokinase, phosphofructokinase, pyruvate kinase.
Regulation: Allosteric regulation by ATP, AMP, and fructose 2,6-bisphosphate.
Regulation of Glycolysis in Muscle
Glycolysis is regulated by energy status and substrate availability.
High ATP: Inhibits phosphofructokinase.
High AMP: Activates phosphofructokinase.
Krebs Cycle (TCA Cycle)
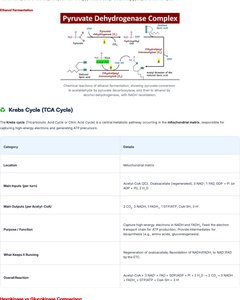
Overview
The Krebs cycle (Tricarboxylic Acid Cycle or Citric Acid Cycle) is a central metabolic pathway occurring in the mitochondrial matrix, responsible for oxidizing major energy substrates and generating ATP, NADH, and FADH2.
Category | Details |
|---|---|
Location | Mitochondrial matrix |
Main Substrates (per turn) | Acetyl-CoA, Oxaloacetate, Isocitrate, α-Ketoglutarate, Succinyl-CoA, etc. |
Purpose & Function | Oxidation of acetyl groups, generation of NADH, FADH2, GTP/ATP, and CO2 |
Metabolic Balancing | Links carbohydrate, fat, and protein metabolism |
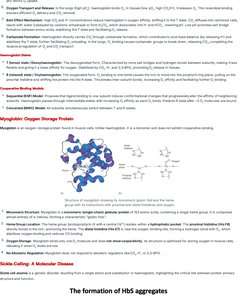
Electron Transport Chain (ETC)
Organization and Mobile Carriers
The ETC is a series of protein complexes and mobile carriers located in the inner mitochondrial membrane that captures high-energy electrons from NADH and FADH2 and generates ATP through oxidative phosphorylation.
Complexes: Four main complexes (I-IV) transfer electrons and pump protons.
Mobile Carriers: Ubiquinone (CoQ), cytochrome c.
Complex | Main Function | Inputs/Outputs | H+ Pumped | Key Mechanistic Steps |
|---|---|---|---|---|
Complex I | Oxidizes NADH | NADH → NAD+, Q → QH2 | 4 | Electron transfer, proton pumping |
Complex II | Oxidizes FADH2 | FADH2 → FAD, Q → QH2 | 0 | Electron transfer |
Complex III | Transfers electrons from QH2 to cytochrome c | QH2 → Q, cyt c (ox) → cyt c (red) | 4 | Q cycle, proton pumping |
Complex IV | Reduces O2 to H2O | cyt c (red) → cyt c (ox), O2 → H2O | 2 | Oxygen reduction, proton pumping |