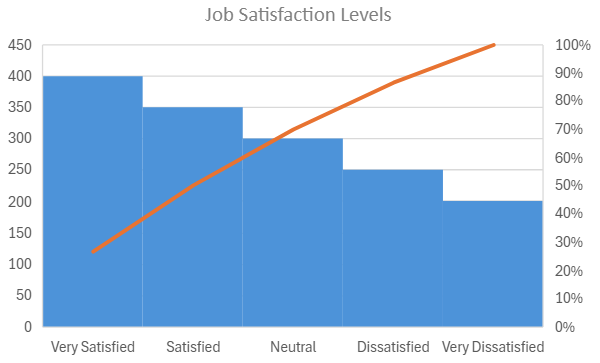
A company surveyed employees about their job satisfaction levels. The responses were categorized into the following groups: Very Satisfied, Satisfied, Neutral, Dissatisfied, and Very Dissatisfied. The survey results are shown in the given Pareto chart. What is the probability that a randomly chosen employee is either Neutral or Dissatisfied?