Skip to main content
Statistics for Business
My Course
Learn
Exam Prep
AI Tutor
Study Guides
Flashcards
Explore
Try the app
My Course
Learn
Exam Prep
AI Tutor
Study Guides
Flashcards
Explore
Try the app
Back
Addition Rule
Download worksheet
Problem 1
Problem 2
Problem 3
Problem 4
Problem 5
Problem 6
Problem 7
Problem 8
Problem 9
Problem 10
Addition Rule
Download worksheet
Practice
Summary
Previous
5 of 10
Next
4. Probability / Addition Rule / Problem 5
Problem 5
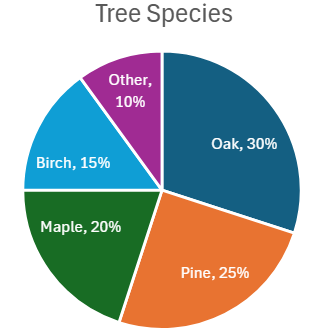
The pie chart displays the projected percentage distribution of tree species in a forest. Determine the probability of randomly selecting a pine tree.
A
0.30
0.30
B
0.35
0.35
C
0.20
0.20
D
0.25
0.25
AI tutor
0
0 Comments
Show Answer
More options