Skip to main content
Statistics for Business
My Course
Learn
Exam Prep
AI Tutor
Study Guides
Flashcards
Explore
Try the app
My Course
Learn
Exam Prep
AI Tutor
Study Guides
Flashcards
Explore
Try the app
Back
Distribution of Sample Mean - Excel definitions
You can tap to flip the card.
Sampling Distribution
You can tap to flip the card.
👆
Sampling Distribution
A probability distribution showing all possible values of sample means from repeated samples of the same size.
Track progress
Control buttons has been changed to "navigation" mode.
1/15
Related flashcards
Related practice
Recommended videos
Distribution of Sample Mean - Excel quiz
Distribution of Sample Mean - Excel
15 Terms
Introduction to Confidence Intervals
7. Sampling Distributions & Confidence Intervals: Mean
10 problems
Topic
Justin
7. Sampling Distributions & Confidence Intervals: Mean
3 topics
15 problems
Chapter
Ally
Guided course
05:15
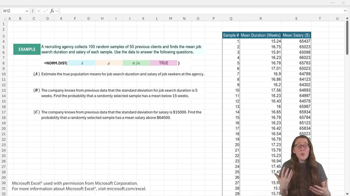
Finding Probabilities for Sample Means - Excel Example 2
98
views
4
rank
Guided course
08:08
Finding Probabilities for Sample Means - Excel Example 1
126
views
Guided course
09:51
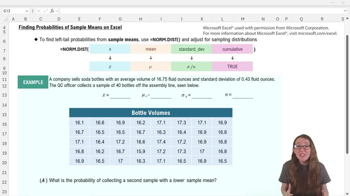
Finding Probabilities for Sample Means - Excel
202
views
4
rank
Terms in this set (15)
Hide definitions
Sampling Distribution
A probability distribution showing all possible values of sample means from repeated samples of the same size.
Sample Mean
The arithmetic average of values in a sample, used as a point estimate for the population mean.
Population Mean
The average value of a variable for the entire population, often denoted by the Greek letter μ.
Standard Deviation
A measure of variability indicating how much individual values differ from the mean in a data set.
Central Limit Theorem
A statistical principle stating that the sampling distribution of the mean approaches normality as sample size increases.
Normal Distribution
A symmetric, bell-shaped probability distribution characterized by its mean and standard deviation.
Left Tail Probability
The probability that a sample mean falls below a specified value in a distribution.
Right Tail Probability
The probability that a sample mean exceeds a specified value in a distribution.
Sample Size
The number of observations or data points included in a sample, often represented by n.
Sigma
The symbol representing the standard deviation of a population.
Cumulative Probability
The probability that a random variable is less than or equal to a specific value.
NORM.DIST Function
An Excel function used to calculate cumulative probabilities for normal distributions.
Quality Control
A process in manufacturing or business that uses statistical methods to monitor and maintain product standards.
Inferential Statistics
A branch of statistics focused on drawing conclusions about populations based on sample data.
Standard Error
The standard deviation of the sampling distribution, calculated as population standard deviation divided by the square root of sample size.
 BackBack


 05:15
05:15