Skip to main content
Statistics for Business
My Course
Learn
Exam Prep
AI Tutor
Study Guides
Flashcards
Explore
Try the app
My Course
Learn
Exam Prep
AI Tutor
Study Guides
Flashcards
Explore
Try the app
Back
Distribution of Sample Mean - Excel quiz
You can tap to flip the card.
What Excel function is used to find left tail probabilities for sample means in a sampling distribution?
You can tap to flip the card.
👆
What Excel function is used to find left tail probabilities for sample means in a sampling distribution?
The =NORM.DIST function is used, with cumulative set to true.
Track progress
Control buttons has been changed to "navigation" mode.
1/15
Related flashcards
Related practice
Recommended videos
Distribution of Sample Mean - Excel definitions
Distribution of Sample Mean - Excel
15 Terms
Introduction to Confidence Intervals
7. Sampling Distributions & Confidence Intervals: Mean
10 problems
Topic
Justin
7. Sampling Distributions & Confidence Intervals: Mean
3 topics
15 problems
Chapter
Ally
Guided course
05:15
Finding Probabilities for Sample Means - Excel Example 2
98
views
4
rank
Guided course
08:08
Finding Probabilities for Sample Means - Excel Example 1
126
views
Guided course
09:51
Finding Probabilities for Sample Means - Excel
202
views
4
rank
Terms in this set (15)
Hide definitions
What Excel function is used to find left tail probabilities for sample means in a sampling distribution?
The =NORM.DIST function is used, with cumulative set to true.
What is the first input for the =NORM.DIST function when finding probabilities for sample means?
The first input is x̄, the sample mean you want to find the probability for.
How do you calculate the mean of a sample in Excel?
Use the =AVERAGE function and select the sample data cells.
What value is used as the mean input in =NORM.DIST for sampling distributions?
The population mean μ is used as the mean input.
How do you calculate the standard deviation of the sampling distribution in Excel?
Divide the population standard deviation σ by the square root of the sample size n.
What should the cumulative input be set to in =NORM.DIST when finding left tail probabilities?
Set cumulative to TRUE to get the cumulative probability.
How do you find the probability of getting a sample mean above a certain value in Excel?
Subtract the left tail probability from one: 1 - NORM.DIST(...).
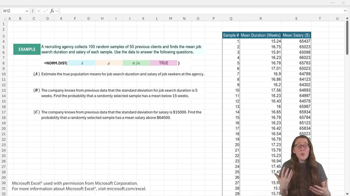
What is the sample size n in the example provided in the transcript?
The sample size n is 40.
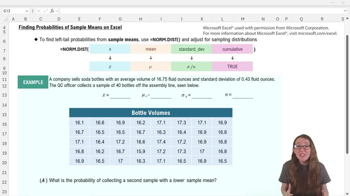
What is the population mean μ for the soda bottle example?
The population mean μ is 16.75 fluid ounces.
What is the population standard deviation σ for the soda bottle example?
The population standard deviation σ is 0.43 fluid ounces.
What is the calculated sample mean x̄ for the sample in the example?
The sample mean x̄ is 16.755.
What is the calculated standard deviation of the sampling distribution in the example?
It is approximately 0.01.
What is the probability of collecting a second sample with a lower sample mean than 16.755?
The probability is about 0.68, or 68%.
What is the probability of collecting a second sample with a higher sample mean than 16.755?
The probability is about 0.32, or 32%.
What theorem allows us to use the normal distribution for sample means when n is large?
The Central Limit Theorem allows this, as sampling distributions become normal when n ≥ 30.
 BackBack


 05:15
05:15