Skip to main content
Statistics for Business
My Course
Learn
Exam Prep
AI Tutor
Study Guides
Flashcards
Explore
Try the app
My Course
Learn
Exam Prep
AI Tutor
Study Guides
Flashcards
Explore
Try the app
Back
Histograms w/ Graphing Calculator definitions
You can tap to flip the card.
Histogram
You can tap to flip the card.
👆
Histogram
A bar graph displaying the frequency distribution of a data set, with bars representing class intervals.
Track progress
Control buttons has been changed to "navigation" mode.
1/14
Related flashcards
Related practice
Recommended videos
Histograms w/ Graphing Calculator quiz
Histograms w/ Graphing Calculator
15 Terms
Histograms w/ Graphing Calculator
2. Describing Data with Tables and Graphs
10 problems
Topic
Bar Graphs and Pareto Charts
2. Describing Data with Tables and Graphs
10 problems
Topic
Ernest
2. Describing Data with Tables and Graphs
10 topics
15 problems
Chapter
David-Paige
Guided course
06:04
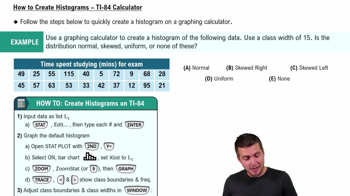
How to Create Histogram - TI-84 Calculator
223
views
4
rank
Guided course
07:10
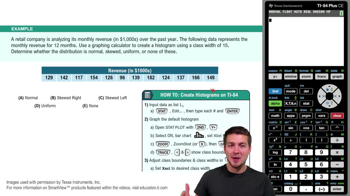
How to Create Histogram - TI-84 Calculator
372
views
2
rank
Terms in this set (14)
Hide definitions
Histogram
A bar graph displaying the frequency distribution of a data set, with bars representing class intervals.
Frequency Distribution
A summary showing how many data values fall within specified ranges or classes.
Class Width
The difference between the lower limits of consecutive classes in a frequency distribution.
Class Limits
The smallest and largest data values that can belong to a class interval.
TI-84 Calculator
A graphing device used to input data, create statistical plots, and analyze distributions efficiently.
Stat Plot
A calculator feature that enables graphical representation of data, including histograms and other plots.
ZoomStat
An automatic calculator function that adjusts the viewing window to fit the data set for statistical graphs.
Xmin
A window setting specifying the minimum x-axis value displayed on a graph.
Xmax
A window setting specifying the maximum x-axis value displayed on a graph.
Xscl
A window parameter that determines the scale or width of each class interval on the x-axis.
Trace Button
A calculator function allowing navigation through plotted data to view frequencies and class boundaries.
Normal Distribution
A symmetrical, bell-shaped data pattern where values cluster around a central mean.
Skewed Distribution
A data pattern where values are asymmetrically distributed, with a tail extending to one side.
Uniform Distribution
A data pattern where all values are spread evenly across the range, resulting in bars of equal height.
 BackBack

 06:04
06:04