Skip to main content
Statistics for Business
My Course
Learn
Exam Prep
AI Tutor
Study Guides
Flashcards
Explore
Try the app
My Course
Learn
Exam Prep
AI Tutor
Study Guides
Flashcards
Explore
Try the app
Back
Histograms w/ Graphing Calculator quiz
You can tap to flip the card.
What is the first step to create a histogram on a TI-84 calculator?
You can tap to flip the card.
👆
What is the first step to create a histogram on a TI-84 calculator?
Input your data into a list by pressing the STAT button, selecting EDIT, and entering your numbers.
Track progress
Control buttons has been changed to "navigation" mode.
1/15
Related flashcards
Related practice
Recommended videos
Histograms w/ Graphing Calculator definitions
Histograms w/ Graphing Calculator
14 Terms
Histograms w/ Graphing Calculator
2. Describing Data with Tables and Graphs
10 problems
Topic
Bar Graphs and Pareto Charts
2. Describing Data with Tables and Graphs
10 problems
Topic
Ernest
2. Describing Data with Tables and Graphs
10 topics
15 problems
Chapter
David-Paige
Guided course
06:04
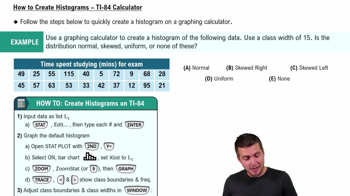
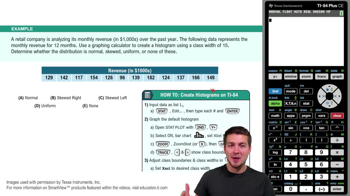
How to Create Histogram - TI-84 Calculator
223
views
4
rank
Guided course
07:10
How to Create Histogram - TI-84 Calculator
372
views
2
rank
Terms in this set (15)
Hide definitions
What is the first step to create a histogram on a TI-84 calculator?
Input your data into a list by pressing the STAT button, selecting EDIT, and entering your numbers.
How do you access the STAT PLOT menu on a TI-84 calculator?
Press the 2nd key and then Y= to access the STAT PLOT menu.
Which graph type should you select in STAT PLOT to create a histogram?
Select the histogram option, which is represented by a bar graph icon.
What does the ZoomStat (option 9) function do when creating a histogram?
ZoomStat automatically adjusts the window to fit your data and display the histogram.
How can you adjust the class width for your histogram on the TI-84?
Change the Xscl (x scale) value in the WINDOW settings to your desired class width.
What should you set Xmin and Xmax to in the WINDOW settings?
Set Xmin to the minimum value of your data set and Xmax to a value near the maximum.
What does the TRACE button do when viewing a histogram on the TI-84?
The TRACE button allows you to toggle through each class and see their frequencies and class limits.
How do you correct a mistyped number when entering data into a list?
Use the up button to select the incorrect entry and type over it with the correct number.
Is it necessary to enter data in order when inputting into the TI-84 list?
No, you can input the numbers in any order as they appear in your data table.
What does setting the Ymin and Ymax in the WINDOW function affect?
Ymin and Ymax control the vertical scale, adjusting how tall the bars appear in the histogram.
What does a 'skewed right' histogram look like?
A skewed right histogram has data peaking to the left and trailing off to the right.
What is a normal distribution in the context of histograms?
A normal distribution appears as a symmetrical, bell-shaped curve in the histogram.
What does a uniform distribution look like in a histogram?
A uniform distribution has bars of roughly equal height, indicating data is evenly spread.
What does the 'n' value shown when tracing a histogram bar represent?
The 'n' value represents the frequency (f) of data points within that class interval.
Why is using a graphing calculator helpful for creating histograms with large data sets?
It automates the process, saving time and reducing errors compared to doing it by hand.
 BackBack

 06:04
06:04